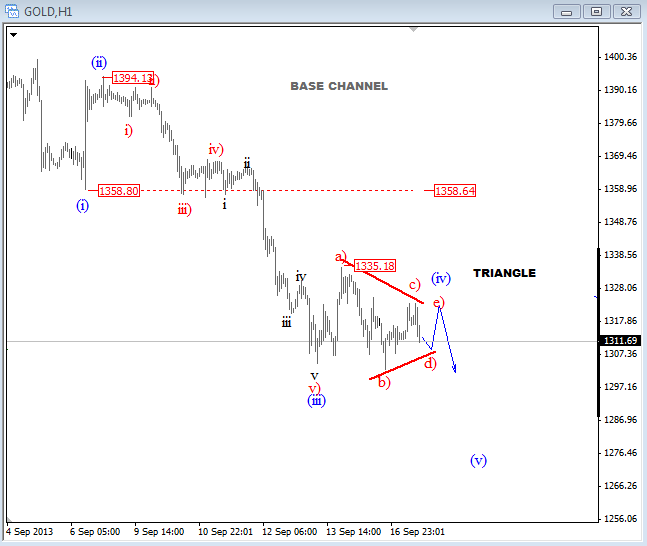
GOLD has turned bearish last week and made a sharp decline towards 1300 with a personality of an impulsive price action; a strong and large move in a short period of time. As such, we believe that the precious metal is in a new bearish period which could bring the price even back to June lows. We will be looking lower as long as 1434 is in place. With that said, to take advantage of the current downtrend move it’s important to keep an eye on intra-day wave patterns and any evidence of a corrective or contra-trend pattern that will give you an opportunity to join the trend.
Well, on the hourly chart we see a sideways movement in a tight range, which is a very important guideline for a correction, or a temporary pause within the downtrend. From an Elliott Wave perspective we see the current pause as a triangle which is a continuation pattern, most likely placed in wave four. As such, we anticipate a thrust out of a triangle into wave (v) that could reach levels around 1280 in the next 24-48 hours once 1300 support is taken out.
GOLD 1h

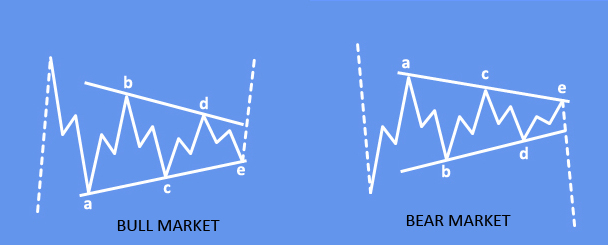
TRIANGLE-BASIC STRUCTURE
A Triangle is a common 5 wave pattern labeled A-B-C-D-E that moves counter-trend and is corrective in nature. Triangles move within two channel lines drawn from waves A to C, and from waves B to D. A Triangle is either contracting or expanding depending on whether the channel lines are converging or expanding. Triangles are overlapping five wave affairs that subdivide 3-3-3-3-3.

- Structure is 3-3-3-3-3
- Each subwave of a triangle is ussaly a zig-zag
- Wave E must end in the price territory of wave A
- One subwave of a triangle usually has a much more complex structure than others subwaves
- Appears in wave four in an impulse, wave B in an A-B-C, wave X or wave Y in a double threes, wave X or wave Z in a triple threes
