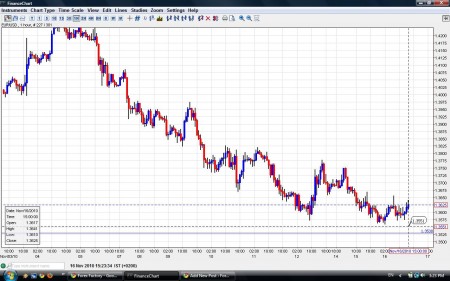
Netdanaia, one of the best forex charts provider, recently made some small yet improvements to its finance charts. These improvements allow more flexibility and make their Finance Charts product easier to use.
 All the changes are visible in the image – click to enlarge.
The first and most notable improvement is the addition of grid lines to the charts – this makes it easier to see technical levels, especially round ones. The grid lines are in the right thickness – they are visible but don’t take over important price data.
Another improvement is the ability to drag the charts beyond current levels – for example, if I look at the hourly chart of EUR/USD and want to mark lower levels and then focus on the current hours, I can still drag the graph and my lower lines.
The third improvement is that there’s no need to open the information window to see the exact numbers – the information window appears on the bottom left side of the screen, yet again, not taking over the important price data. This makes the usage more swift.
I guess there are further additions that I haven’t noticed. Anyway, they continue having an excellent product – one of the best for viewing forex exchange rates.
Here’s another article about previous Netdania improvements.
Want to see what other traders are doing in real accounts? Check out Currensee. It’s free..
