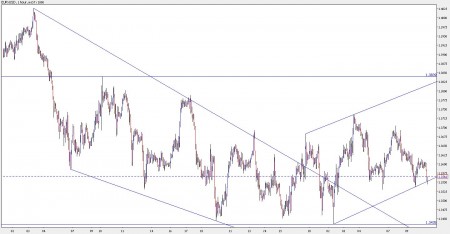
EUR/USD is trading in a range for over a month. While the long term trend is bearish, some bullish hints can be found within this range.
Since February 4th, EUR/USD plunged into a range between 1.3423 to 1.3850. At the beginning the trend in the hourly charts was negative. On February 19th, the bottom line of 1.3423 was approached for the first time. And later, the peak was lower than previous peaks – 1.3690 on February 23rd.

EUR/USD hourly trends. Click to enlarge
This narrow range of 1.3423 to 1.3690 continued until March 4th. And then, EUR/USD approached 1.3750 and fell only to 1.3530, far enough from the bottom.
In the chart above, you can see the trend changing from bearish to bullish. But this is a narrow time frame. Since the peak of 1.5144 in December, the long term trend of EUR/USD is down.
Fundamentals support the long term downtrend: Europe’s recovery is slower than expected, the unemployment rate is high and the debt problems from all over the continent continue to weigh on the Euro.
The levels to watch continue to be 1.3423 and 1.3850. A break of these levels will indicate the long term direction. In the meantime, range trading, which characterizes this pair, will be further seen.
Want to see what other traders are doing in real accounts? Check out Currensee. It’s free.
