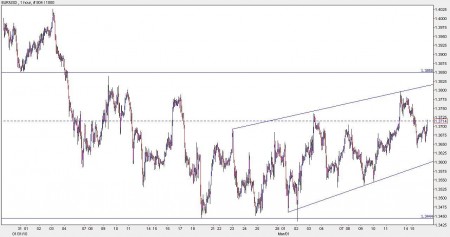
Looking at the hourly charts, EUR/USD is trading in an uptrend channel since the end of February. The near past tells us that the drop is near. The charts can speak for themselves.

EUR/USD bounced off the bottom line of 1.3423 three times at the end of February and the beginning of March. This line was significant for the Euro in the past, back in the spring of 2009.
After going through a downtrend channel, it changed direction and EUR/USD showed bullish signs, but still within the range.. EUR/USD began trading in a clear channel, marked on the graph. There are three consecutive higher bottoms and two consecutive higher peaks.
But similar to the strong support line at 1.3423 that prevented a fall, there’s a strong resistance line from above, that should hold strong against this uptrend. This resistance line is at 1.3850. So, this uptrend will soon encounter a tough barrier.
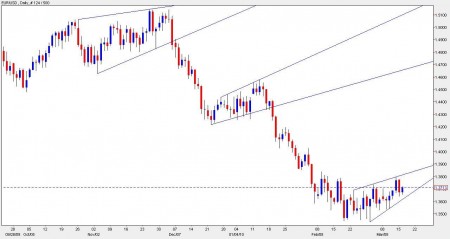
If EUR/USD fails to breach this barrier, the uptrend support will close on the pair from the bottom, and it may suffer a big drop. Let’s see what happened in recent weeks, with this chart:

In this daily chart, we can easily see that the each time that the Euro edged up in an uptrend channel, it was followed by a big drop – a drop that broke below strong support lines. Are we going to see that kind of action now?
There are many major American releases this week that will shake the Euro more than European releases. The critical level is 1.3850 – if EUR/USD reaches this level and doesn’t break, the direction will probably be downhill.
Want to see what other traders are doing in real accounts? Check out Currensee. It’s free.
