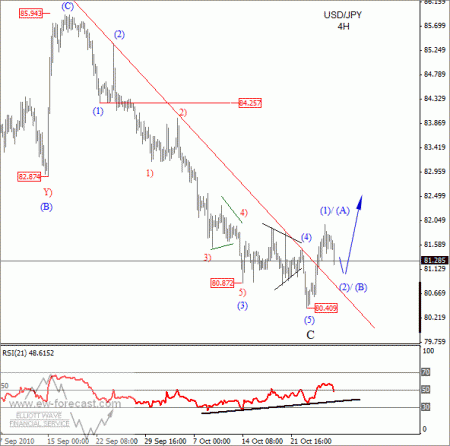
Usd/Jpy formed a sharp impulsive downtrend over the past few weeks, from 85.95 top, which was established after the BOJ intervened in September. Obviously, intervention did not work as pair formed a nice five wave, called an impulsive decline with a recent low at 80.40. Always when five sequence is finished, a correction in the opposite direction occurs; and this is exactly what is unfolding right now on Usd/Jpy.
Guest post by Gregor Horvat
In Elliott Wave theory a correction is always structured minimum by three waves, and since we can see only one leg from the lows we anticipate at least one more push higher after a wave (2)/(B) pull-back is finished. Another evidence for a temporary change in trend is also a broken trend line, connected from 85.95 highs, which may react as a support in the near future, plus bullish divergence on the RSI.
Usd/Jpy 4h chart:

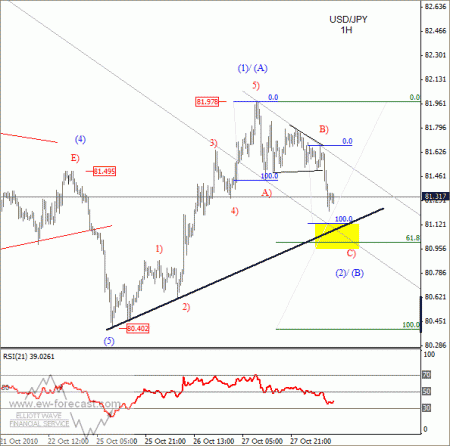
If we go down to 1h chart, then we can see that an impulsive structure from 80.40 found the top yesterday, somewhere around 82.00 region, from where market formed a three wave of decline, which should be a corrective A)-B)-C) move within a blue wave (2)/(B). Traders may keep an eye on a significant support region shown around 81.00-81.15, from where upward continuation could be seen. Wave count and bullish bias remains valid as long as the pair trades above 80.40 lows.
Usd/Jpy 1h chart:

Want to see what other traders are doing in real accounts? Check out Currensee. It’s free..
