Aud/Usd reversed very nicely from the 1.0070 resistance region, exactly after the market tested 61.8% Fibonacci retracement area. Upward bounce from 0.9802 was clearly made in three wave formation, and current sharp 140 pips of decline suggests that top of a black wave 2/B is in.
As such, traders should now focus on more bears ahead, towards and below 0.9800 region, since we are expecting an impulsive decline down into a wave 3/C leg. Once 0.9802 region is out, losses may easily accelerate down to 0.9640 region, where a distance of wave 3/C equals to wave 1/A .
Guest post by Gregor Horvat.
Wave count and expectations remains valid as long as the market trades below 1.0070.
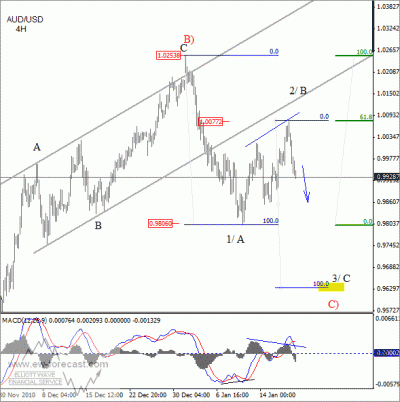
AUD USD Waves – Click to enlarge
The main driver of Aud/Usd weakness from 1.0070 region are lower commodity prices and sell-off seen yesterday on the US stock market. On the chart below you can see a very tight correlation between the S&P futures and Aud/Usd, since the market reversed from the recent highs.
After the yesterday’s weakness on the stock market, further decline in the near-term will likely follow, a move that should drive the Aud/Usd even lower!
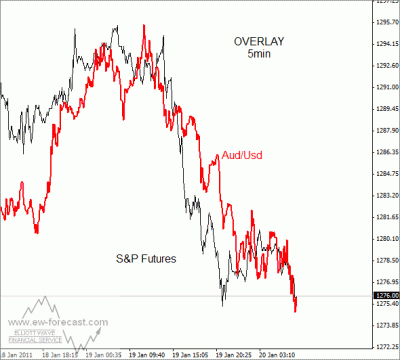
AUD/USD S&P Overlay – Click to enlarge
If you need more Elliott Wave forecast, please visit our website and check Video Tour of Our Products here.