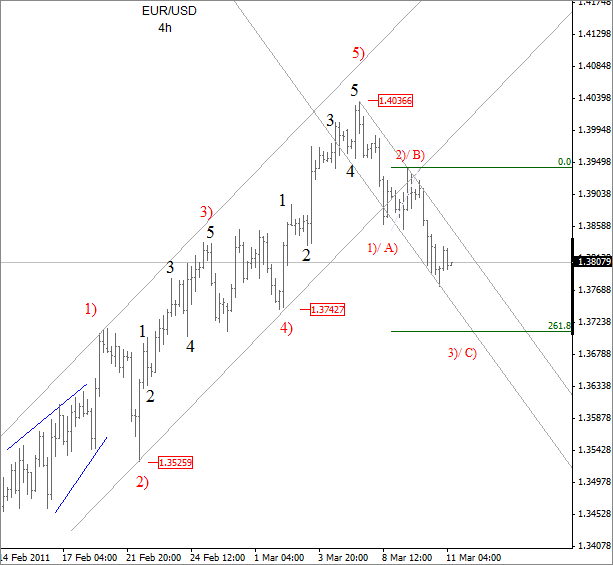
Eur/Usd reached new lows in recent sessions, mostly driven by lower stocks prices. We see evidence of a deeper price action on Eur/Usd, especially since the pair also broke through the lower support line of a previous bullish channel.
As you can see on the chart, the pair is breaking into a third wave of decline, labelled as a red wave 3)/C). As such, we still dont know if decline from the highs is just a correction or start of something bigger. Well, fall down to 1.3700 region will definitely suggest that we are in impulsive sequence here, which in this case means more downside for Eur/Usd.

Guest post by Gregor Horvat
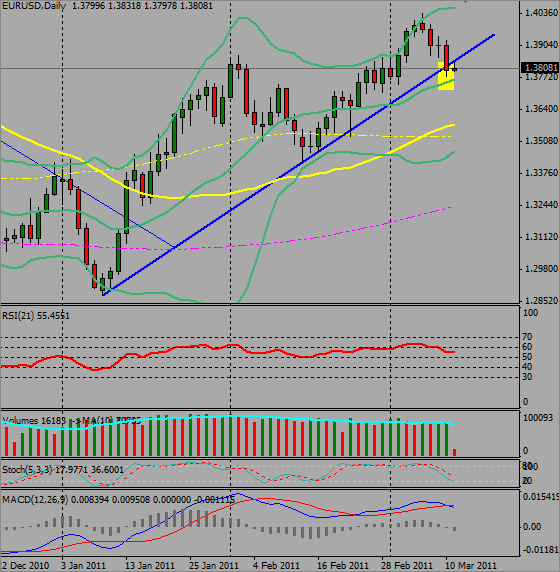
Today, traders should also pay attention on a weekly and daily close price, which may provide much more weakness in a coming week if the blue support line connected from start of 2011 shown on a daily chart is broken.
If you need more Elliott Wave forecast, please visit our website and check Video Tour of Our Products here, or follow us on twitter.

