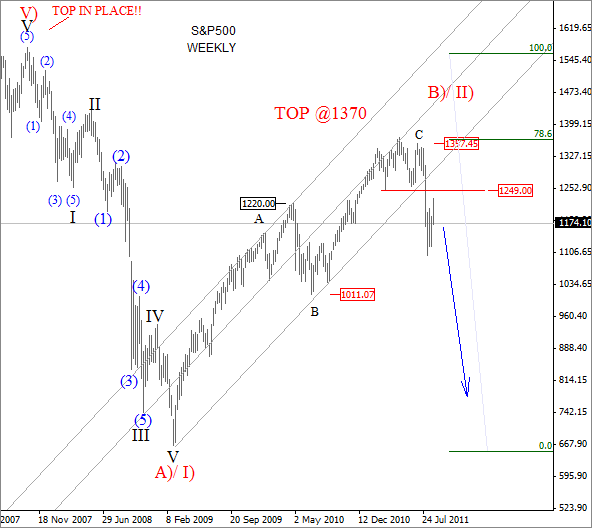
The US stock market moved significantly lower in August, with S&P500 down to 1100 region once the critical region at 1249 (March 2011 lows) was taken out.
Below we have a weekly chart, where you will notice that prices also broke through the lowest support line of a corrective channel which is a very strong indication of a completed wave B)/II) around 1370. In such case we know that market is headed much lower, and the reason is a recovery since March 2008 which was clearly in three waves.
Guest post by Gregor Horvat
Three wave pattern as we know is a corrective structure, and since market already made one impulse down from 2007 pick, we know that long-term trend has changed from bullish to bearish. With this being said, investors and traders, who are aware of an extremely bearish technical picture, should move their money out of risky assets into cash.
During the crisis money is also going into the bonds, but this safe-haven may not last long, and here is the reason WHY, taken from the book Conquer the Crash (Chapter 15), written by Robert R. Prechter Jr.
- “Any bond issued by a borrower who cannot pay goes to zero in a depression. In the Great Depression, bonds of many companies, municipalities and foreign governments were crushed. They became wallpaper as their issuers went bankrupt and defaulted. Bonds of suspect issuers also went way down, at least for a time. Understand that in a crash, no one knows its depth, and almost everyone becomes afraid. That makes investors sell bonds of any issuers that they fear could default. Even when people trust the bonds they own, they are sometimes forced to sell them to raise cash to live on. For this reason, even the safest bonds can go down, at least temporarily, as AAA bonds did in 1931 and 1932.”
However, you can also take advantage during the “stock collapse”! There are many ETF’s that are negatively correlated with stocks, which means they trade higher when stocks are falling. One of them is called SDS (UltraShort S&P500 Proshares). Well, lets take a look wave count on it.
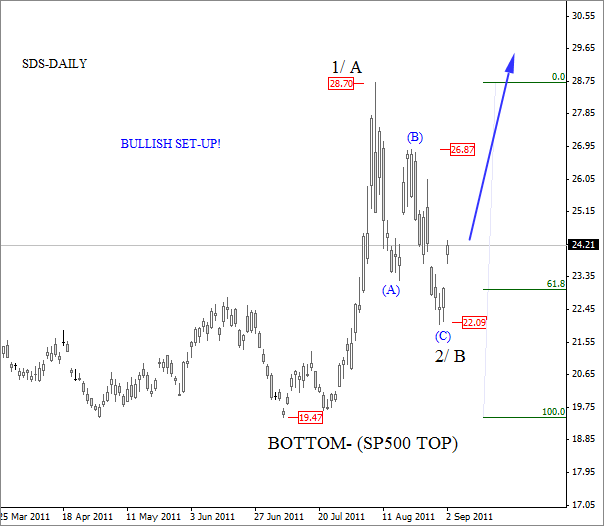
On SDS daily chart, we can see a very sharp rise from July lows, called an impulsive wave in Elliott Wave theory, followed by a three wave of decline from August pick. A corrective retracement that shows first evidences of a completion around 22 region. Further rise and close above 27 will confirm a bullish trend towards and above 30, while the S&P500 (cash market) will be moving lower.
Will you stay in cash, or will you move your money into assets like SDS is your decision, but keep in mind that there could be a good buying opportunity ahead of us, once the global bear market finds the bottom somewhere below March 2008 low.
For more analysis vist us at www.ew-forecast.com or follow us on twitter.