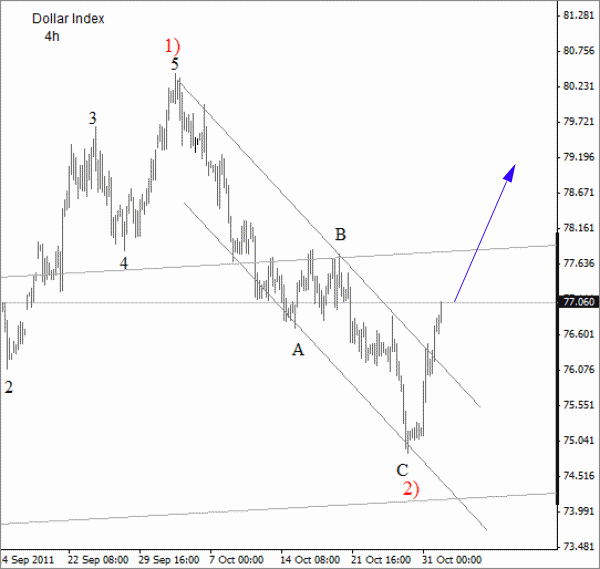
The US dollar gains accelerated through Asia session after RBA cut interest rate to 4.5%. Dollar index trades higher impulsively, so from technical perspective turning point is confirmed, especially as Euro fell well below 1.3800 swing zone.
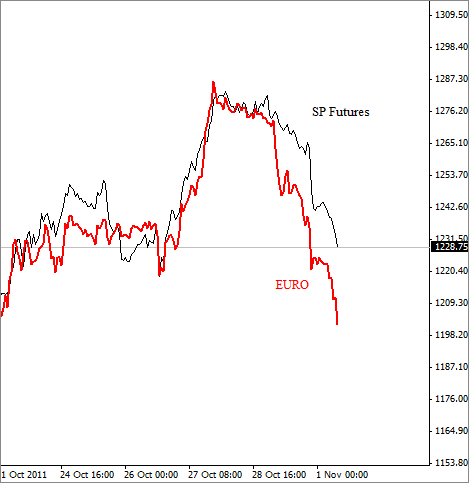
In fact, dollar index made 3-waves down from October 4ht, so further gains are definitely in view now against the majors. Well, on this SP vs. Euro chart, that we already discussed yesterday, can see that RISKY assets now moved lower and are catching up those Euro bearish waves, while Dollar is rising, which is confirming the strength of the buck!
SP Futures vs. Euro chart
Guest post by Gregor Horvat
Dollar Index chart
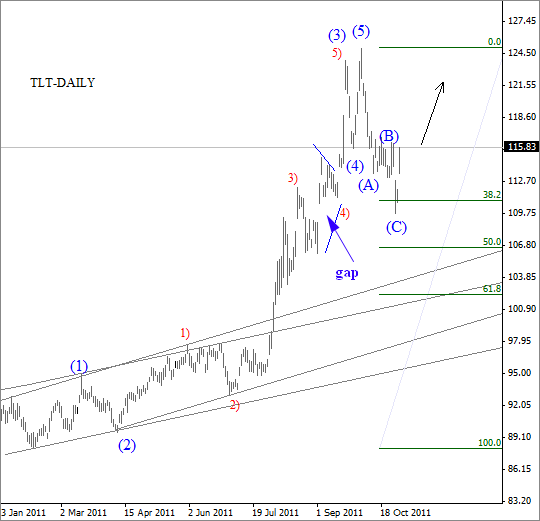
We can also see yields trading lower/ bonds higher, particularly ETF called TLT-iShares Barclays 20+ Year Treasury Bond Fund, which reversed from the gap area after three waves of decline! Further strength on this market is also bullish for the buck, and bearish for stocks.
TLT chart

Bottom line; we favor Long Dollar Positions!
For more analysis visit us at www.ew-forecast.com and try our services with limited special offer *2 for 1* (get two months for price of one)
