Markets are slow and choppy for some time now, and with low liquidity (due to the closure of the US equity market) we think that EURUSD will not break out of this range so soon. But when it will, this will most likely be to the upside, if we consider that pair has turned bullish this summer.

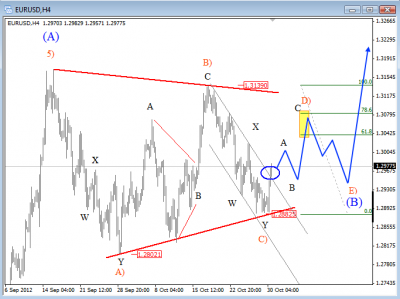
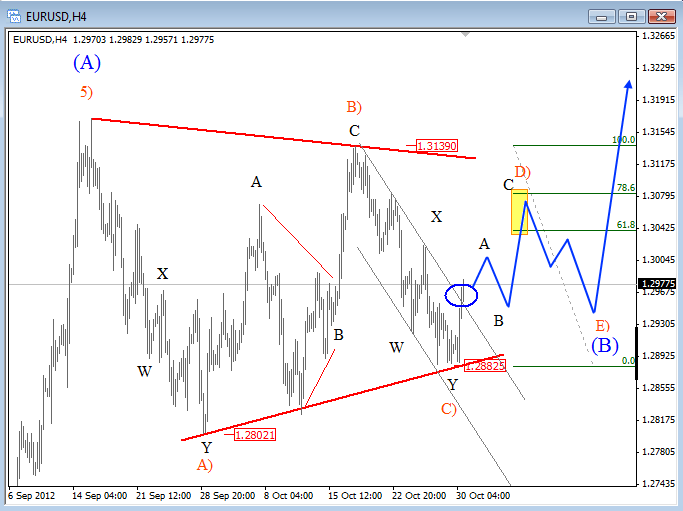
EUR USD Elliott Wave Analysis – Click to enlarge
On the chart below we can see that pair found support a few sessions back around 1.2880, at the trend-line connected from 1.2800 swing from late September. Notice that today’s rise is quite sharp on the intra-day basis which has also extended through the falling channel line.
We think that this is very important, because if the price will close above resistance today, then the trend would turn into a temporary bullish mode. Why temporary? Because we are tracking a triangle and in such case any rally up to 1.3100 will represent wave D), still only the fourth leg of a triangle pattern. However, we need five of them, so our special focus should be on wave E) low once gets underway. Nevertheless, there is still plenty of time until then, so we must be patient, and wait on more price data before we may even consider opportunities to the upside.
To hear and learn more about triangles, please review the video below.
Have a good day!
Get full members access in a less than a minute!! No Credit Card required, no obligations!
Click here for a FREE 7-day trial
