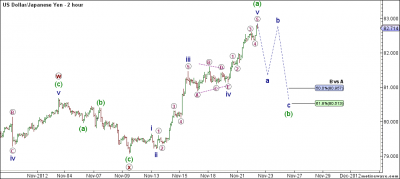
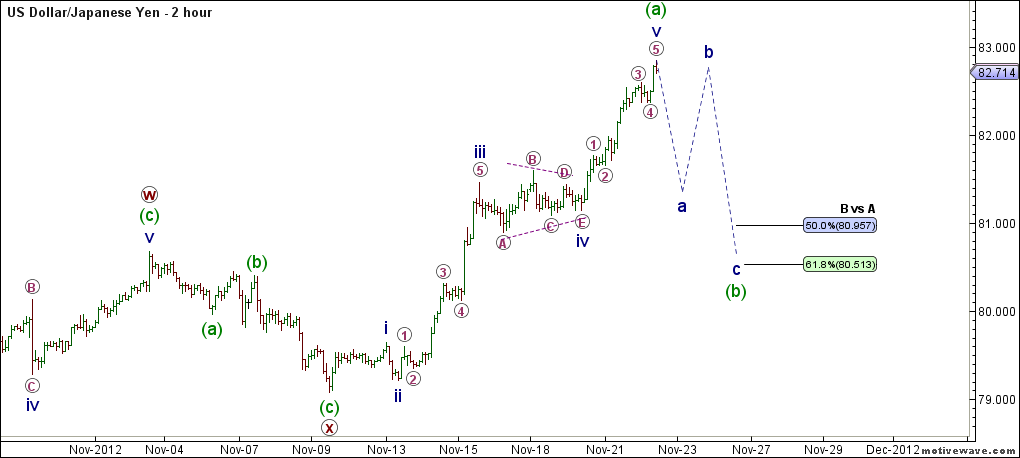
From November 9th, when the USD/JPY pair finished a corrective (X) wave (coloured red) we could observe strong upward move in this currency pair. When we look at the 2-hourly chart, we can see that first corrective (A) wave (coloured green) of the bigger (Y) wave (coloured red) have 5 impulsive wave formed and that we are currently at the start of the (B) corrective wave (coloured green).
Guest post by Nicola Delic of the ND- Blog.

USD/JPY 2 Hour Chart Elliott Wave Analysis – Click image to enlarge
If our wave count is right we can expect to see price dropping below 81.00 level soon. According to Elliott Wave Theory, B corrective wave usually retrace between 50 and 61.8% of the A wave. We can measure the next potential target zone with the help of the Fibonacci Retracement tool (79.06-82.82) and we obtain the next possible target at 80.95 (50% of 2vs1) and 80.51 (61.8% of 2vs1). If price pushed higher and broke the level of 83.00 than our wave count will be invalid, so this is a good Stop Loss level.
Fundamental View
Today there is no incoming news concerning this currency pair, but you should know that United States have Holiday (Thanksgiving Day) , so we do not expect to see much volatility in the Market.
Support and Resistance
(S3) 81.34 (S2) 81.68 (S1) 81.90 (PP) 82.24 (R1) 82.58 (R2) 82.80 (R3) 83.14
Final Conclusion About USD/JPY
The USD/JPY finished the development of the corrective A wave (coloured green) and we are expecting to see the price drop soon when development of the B wave begins. Potential Targets can be set around 80.95 (50% ) and 80.51 (61.8%) , for invalidation we can use end of the (A) wave (colorued green) at a level of 83.00.
