AUD JPY Technical Analysis – Click image to enlarge
For the last six months the AUD/JPY par was trading in a upward movement, today we want see where can this exotic currency pair go in the next few weeks.
So let’s start!
Guest post by Nicola Delic of the ND- Blog.
Technical View
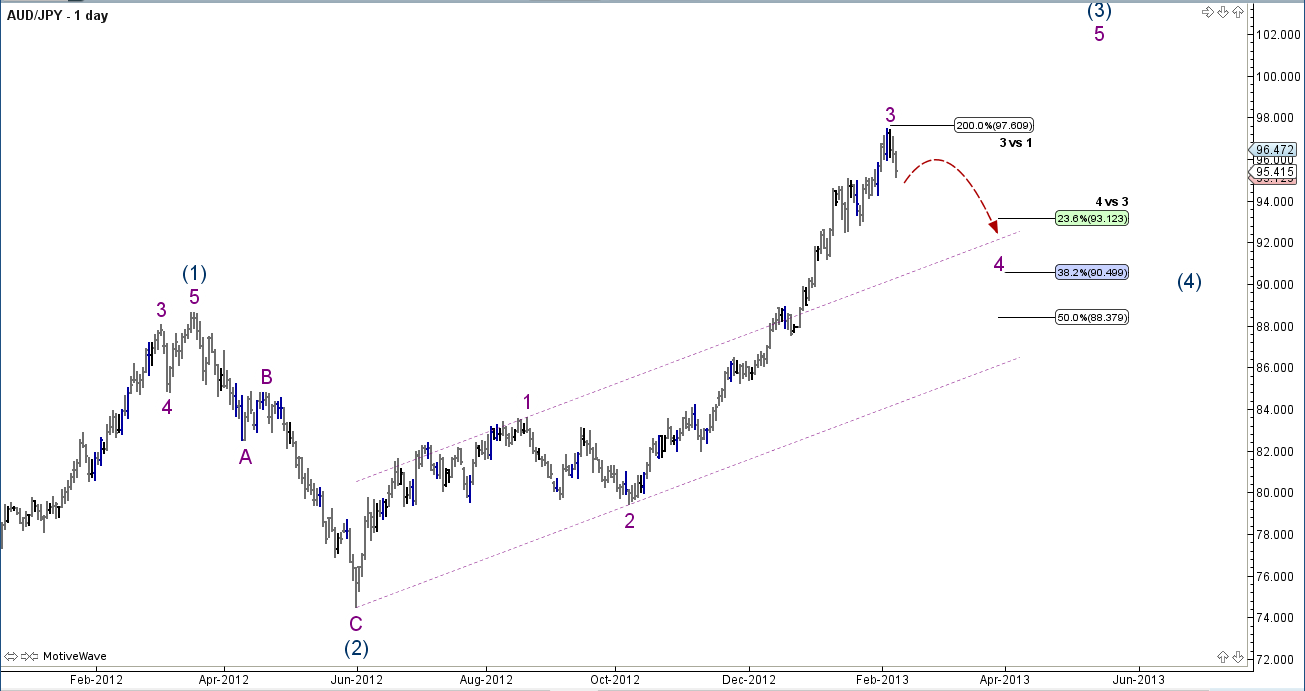
If you look at the 1-day chart we can see that the AUD/JPY pair has finished 3 wave (coloured purple) slightly below 200% of 3vs1, and we are currently at the start of the corrective wave 4 (coloured purple). According to Elliott Waves rules the 4 wave often retraces between 23.6 and 38.2% of the 3 wave so when we measured this levels with Fibonacci retracement tools we got next possible targets at 93.12 (23.6% of 4vs3) and 90.49 (38.2% of 4vs3). This is a longer term targets so let switch to 2-hourls chart to see where this currency pair can go in the next few days.

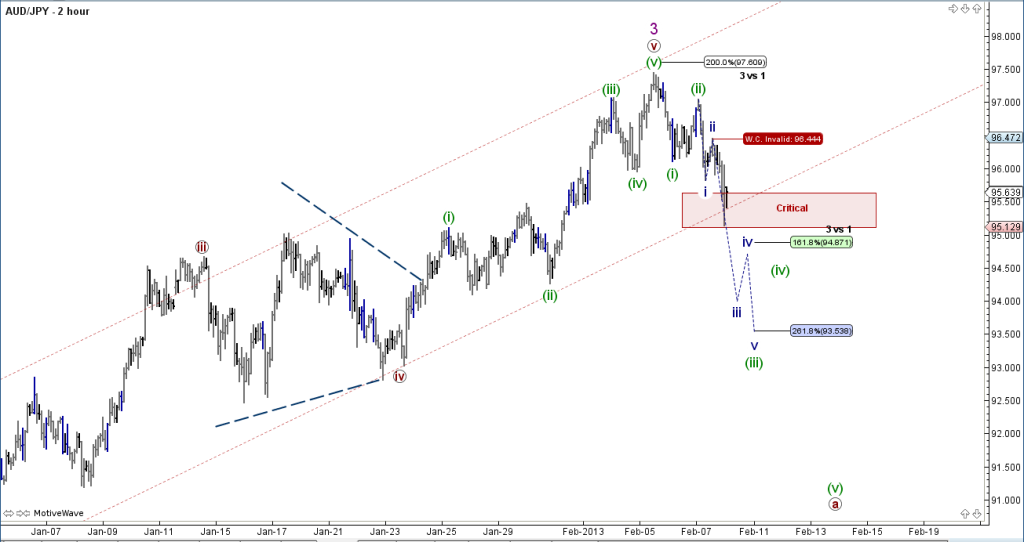
On the 2-hourly chart we can see that corrective wave (A) (coloured red) started, and that we are currently in the 3 impulsive wave (coloured blue) of the bigger (3) wave (coloured green).We know that 3 wave usually retrace between 161.8 and 261.8% of the 1 wave so when we measured this targets we got 93.53 level (261.8% of 3vs1) as good take profit point. If price retrace back to 96.44 our count will be invalid so this is a grate stop loss point.
Final Conclusion
We are expecting to see bearish movement in the AUD/JPY pair so look for Short position around 95.00 level, put Stop Loss at 96.44 and put Take Profit at 93.53 level
Happy Trading
-ND-
@sgcnd
