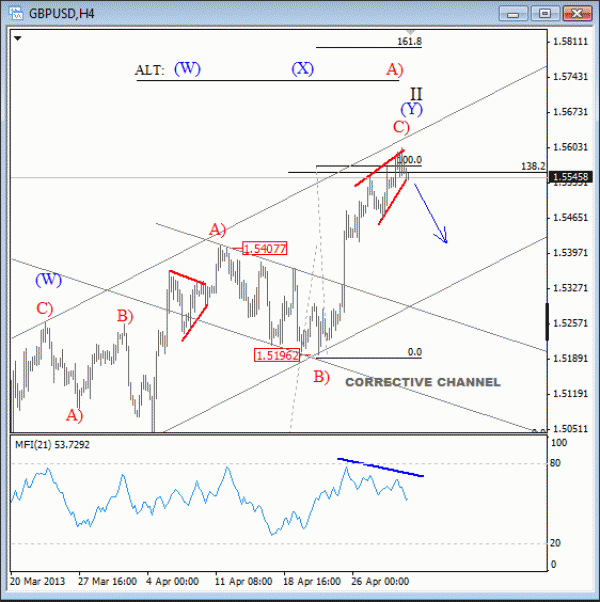
GBPUSD has been trading nicely higher since last week when we have turned bullish after the break through the upper side of a corrective channel that put wave C) in action.
This wave C) could be a final leg of a double zig-zag from March low. If that is the case then the top could be near, around the current 1.5550/1.5600 area, especially if we also consider a divergence on Money Flow Index which shows lower volume in this latest leg higher.
An impulsive sell-off from current levels and back beneath 1.5200 would be strong evidence of a completed uptrend. In such case we will focus on new sell-off towards March swing low.

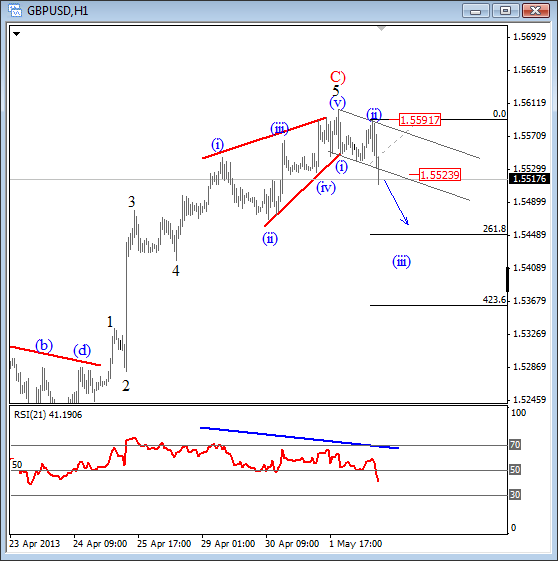
Well on the hourly chart we can count completed five waves up in wave C that shows signs of a top around 1.5606 because of ending diagonal in wave 5, divergence on the RSI and now also accelerating price action below the trading channel which suggests that pair is in early stage of a minor wave (iii). Further weakness towards 1.5450 (typcial thrid wave tartget) and daily close below that level would be a strong and very important sign for further GBPUSD top.

. For more analysis visit us at http://www.ew-forecast.com/
Absolutely FREE 7-day Trial Is Available to New Members!
For more detailed analysis on GBPUSD please check our video from April 29th 2013.
VIDEO April 29 2013
