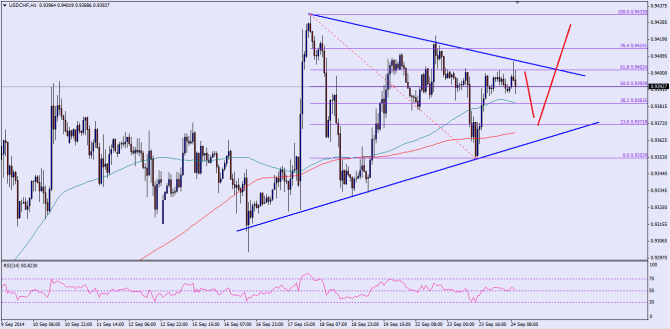
The US dollar is range trading for the last couple days especially against the Swiss franc. However, the USDCHF pair is forming a breakout pattern, which we need to monitor carefully in the short to medium term. The US retail sales data was published yesterday, which missed the expectation and registered a decline. There are a couple of releases today as well, including the US durable goods data and the US initial jobless claims figure. There can be some moves in the USDCHF pair, but it will need a major deviation from the expectation for a break to happen.

As can be seen from the hourly chart of the USDCHF pair, there is a triangle formed which acted as a support and resistance on many occasions. The pair recently failed to break the triangle resistance and currently heading lower again. However, there are several support levels on the way down for the pair starting with the 100 hourly moving average. The most important point is that the 200 hourly moving average is sitting right around the triangle support area. So, the chance of a break higher increase compared to a break below the triangle support trend line. The hourly RSI is also above the 50 level, which is a good sign. So, if the pair dips from the current levels, then it is likely to find buyers around the 0.9370 level.
On the upside, initial hurdle is around the 0.9408 level. If the pair succeeds in breaking the triangle resistance area, then a retest of last high of 0.9433 is possible in the short term.
Overall, buying corrections looks like a good deal as long as the pair is trading above the 200 hourly moving average.
————————————-
Posted By Simon Ji of IKOFX
