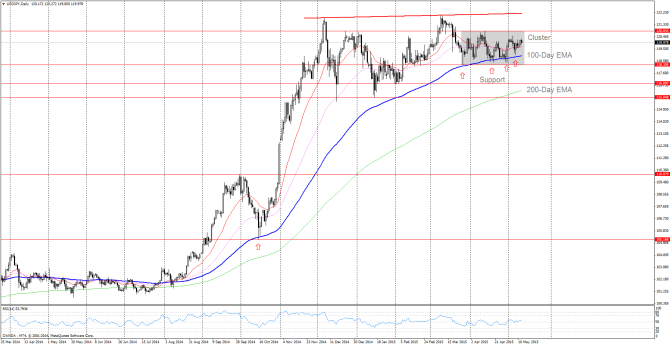
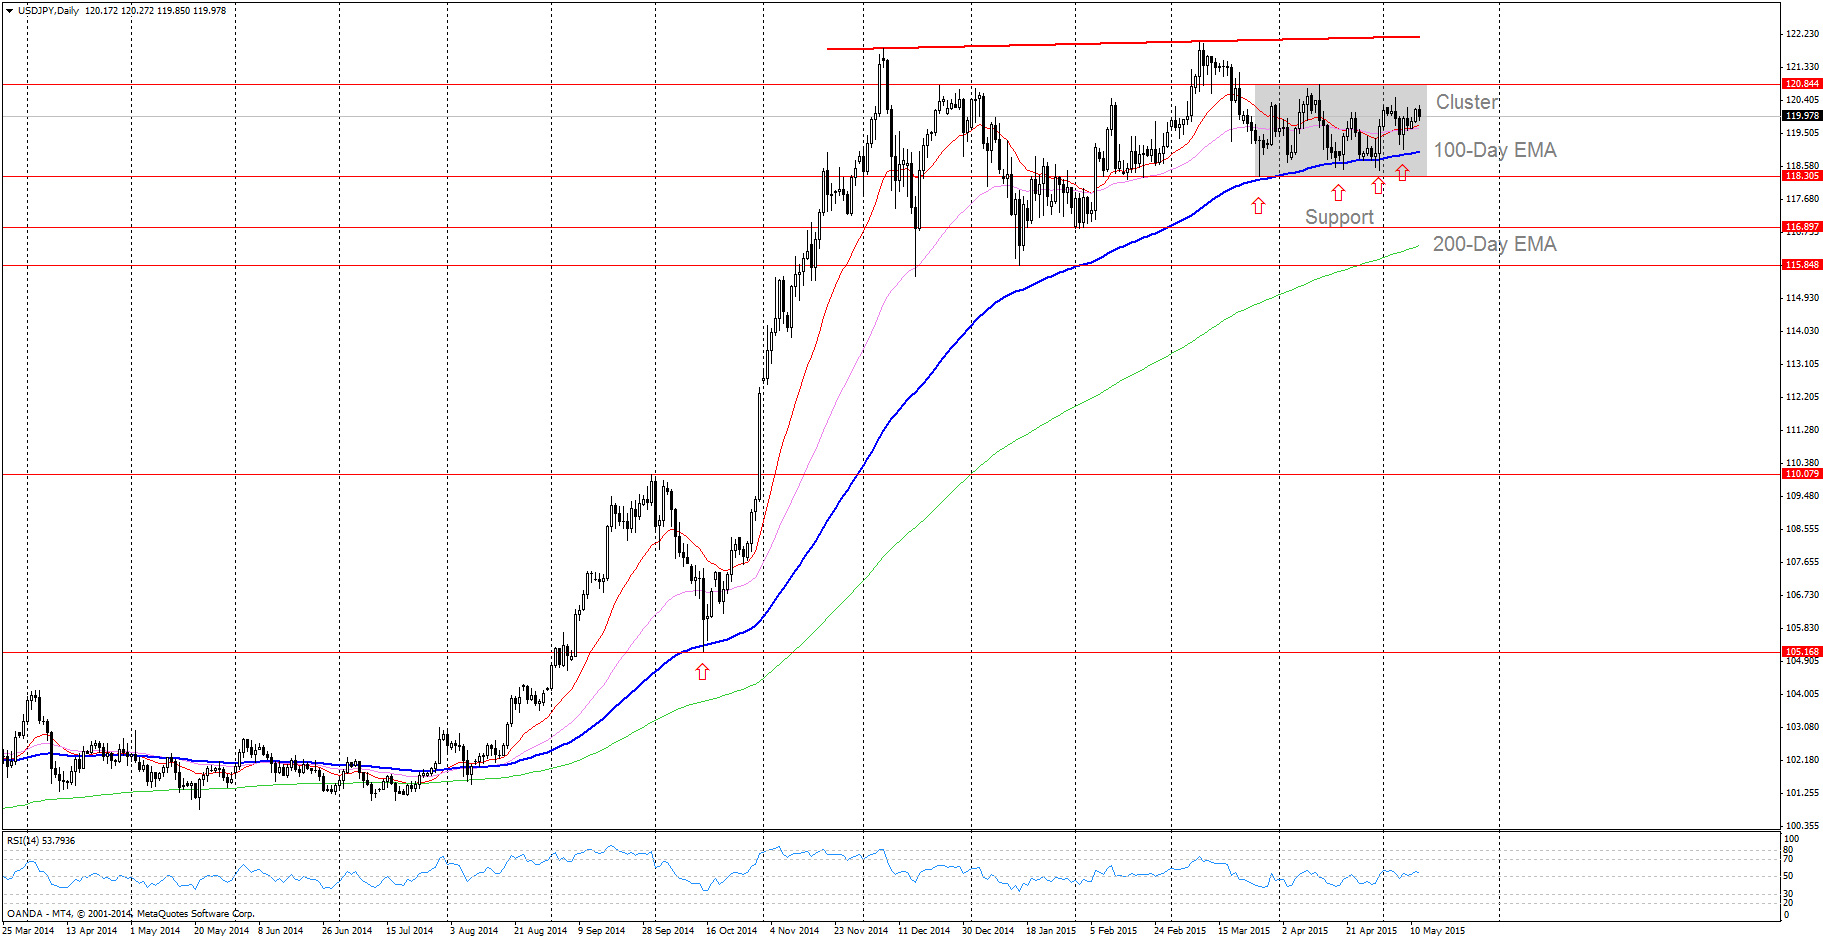
USD/JPY (daily chart as of May 12, 2015) has been trading in a large range since December 7, 2014. The range can be defined as an area between a rising resistance line (connecting the December 7, 2014 high and March 9, 2015 high – bold red line on chart) and its 100-day EMA (bold blue moving average line on chart).

In this large trading range, recent price action has been forming a smaller cluster area (gray shadow on chart) since March 26, between 120.85 level and its 100-day EMA. If the pair can clear 120.85, it could trade higher to test the upper border of the large trading range.
To the downside, if 120.85 remains as resistance, more downward pressure would be expecting for the following trading sessions. Price could decline to test the 100-day EMA again, then 118.30 level, and potentially its 200-day EMA.
Support levels:
S1: 100-day EMA
S2: 118.30 (March 26 low)
S3: 116.90 or 200-day EMA
Resistance levels:
R1: 120.85 (upper border of the cluster area)
R2: upper border of the large trading range
Guest post by Diane Ming, , Contributing Author of InvestingTeacher.com. Diane Ming is an Affiliate Member of the Market Technicians Association (MTA).
Upcoming event risks:
JPY: Current Account and Bank Lending y/y – 7:50pm, Tuesday May 12
CNY: Industrial Production y/y – 1:30am, Wednesday May 13
EUR: German Prelim GDP q/q – 2:00am, Wednesday May 13
GBP: Average Earnings Index 3m/y and Claimant Count Change – 4:30am, Wednesday May 13
GBP: BOE Gov Carney Speaks and Inflation Report – 5:30am, Wednesday May 13
USD: (Core) Retail Sales m/m – 8:30am, Wednesday May 13
USD: (Core) PPI m/m and Unemployment Claims – 8:30am, Thursday May 14
USD: Prelim UoM Consumer Sentiment – 10:00am, Friday May 15
