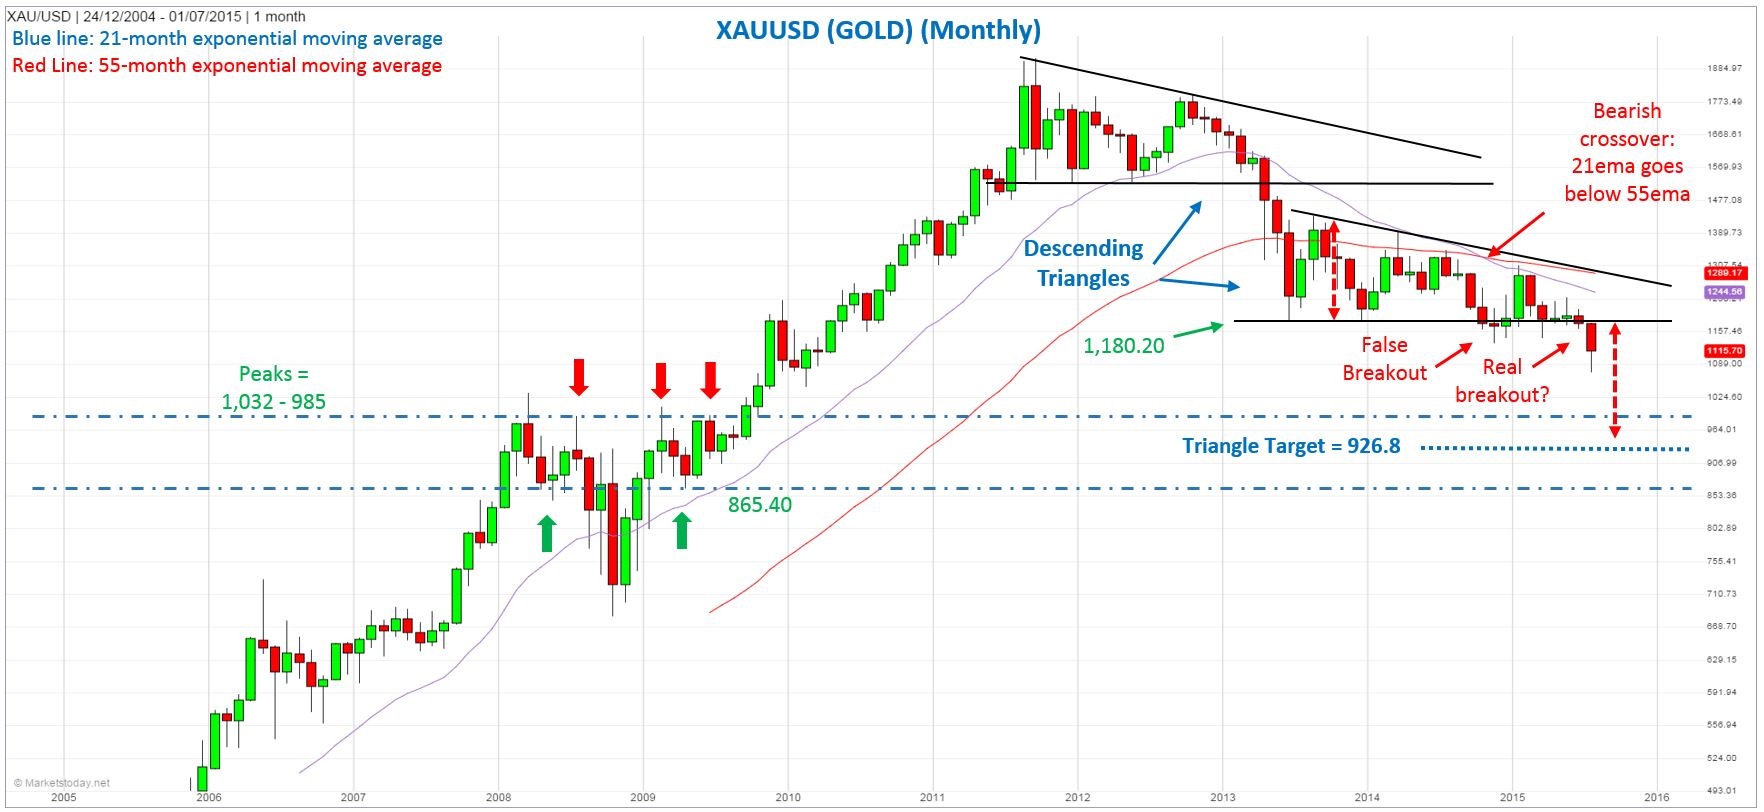
There has now been a clear trigger of a bearish descending triangle formation in Gold (XAU/USD), as can be seen in the monthly chart below. Initially, there was a false breakout last November (dropped below $1,180.20), and another test of support of the pattern in March of this year. Each time Gold managed to rally to some degree before hitting resistance and forming a lower swing low, reflecting underlying selling pressure. What’s being seen now is a classic continuation of a long-term downtrend.
The odds now favor an eventual decline to at least approximately $926.80, which is the measuring objective derived from the descending triangle.
Other price levels to watch for potential support include:
• $1,047.6: most recent ABCD or measured move completion
• $1,023.6: 127.2% Fibonacci extension of the most recent upswing (begun from November low)
• $1,032 – $985: top portion of previous resistance zone from 2008/2009
• $946.9: 78.6% Fibonacci retracement (uptrend from $681.75 low)
• $926.8: Descending Triangle target
• $889.5: 61.8% Fibonacci retracement of very long-term uptrend (from $251.95 1999 low)
• $865.4: previous support area from 2008/2009
Guest Post by Bruce Powers, CMT of Marketstoday.net