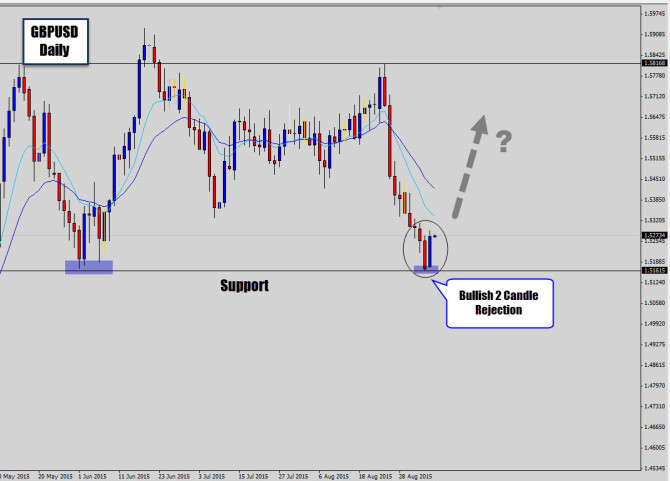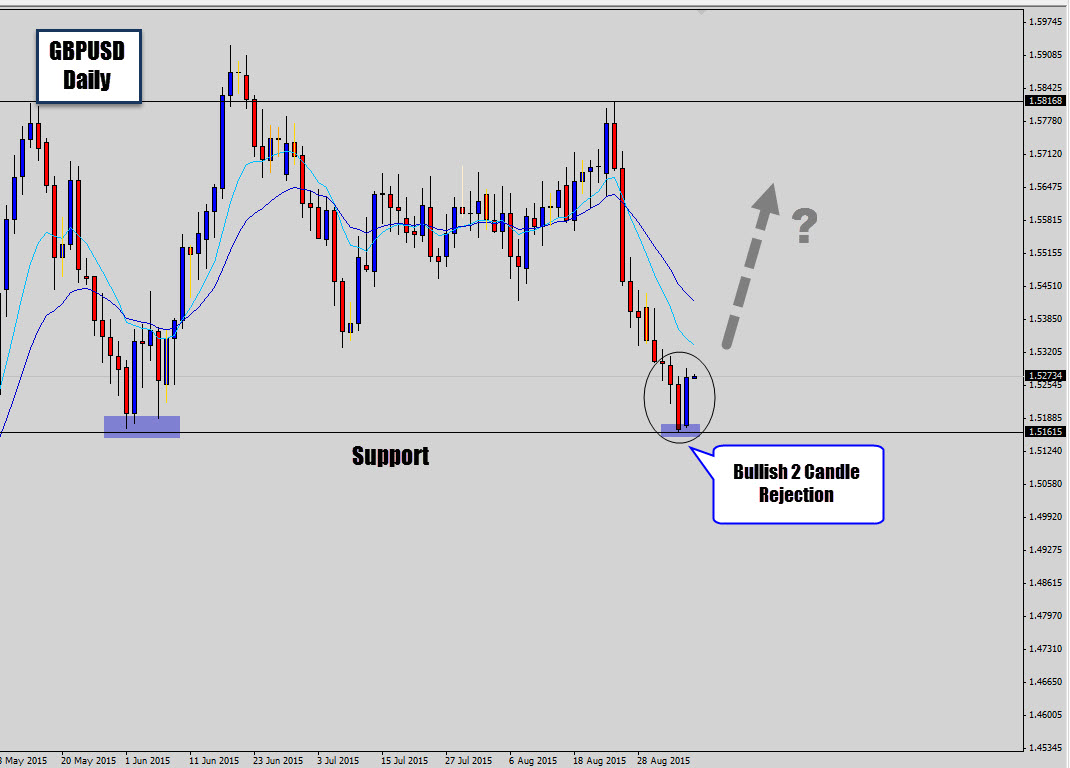
The GBPUSD has recently suffered a hard drop of 8 days of intense selling, moving price from a larger range structure top, sharply to the bottom support.
During the 8 day sell off we haven’t seen any bullish closing days! Now the market has reached a major support level, the bulls have finally decided to step in and give us a bullish closing day – demonstrating the support level is being defended.
This has completed a 2 candle bullish rejection pattern, which is a classic reversal signal that could be the catalyst for a much needed correction.
If the market rebounds up wards, we could see a correction back to a swing level in the middle of the range, or price could complete another range cycle and re-test the range top again – which would generate good returns for this setup.
GBPUSD RALLYS OFF SUPPORT

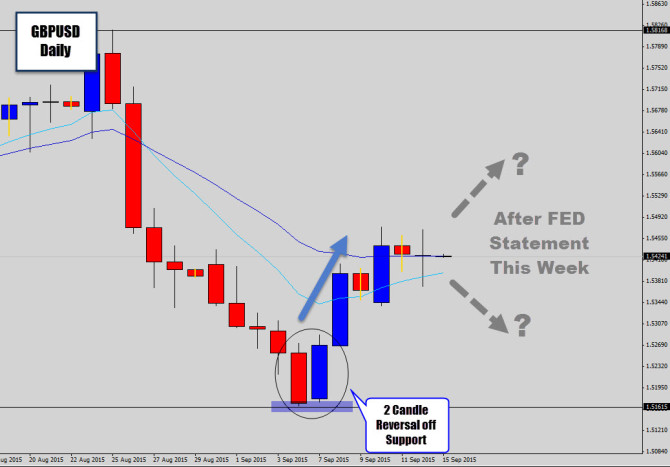
The bullish price action setup we recently covered on the GBPUSD daily chart has started to show good progress. The markets have been quite dull as of late, mainly because everyone is waiting for the feds next move regarding their interest rates.
This week is expected to bring record levels of volatility has the fed decide if they want to raise interest rates or not.
For now price has stalled on the GBPUSD, but the Fed announcement on Thursday will definitely bring some fireworks to this chart and get it moving again.
Most traders will probably take profit here as they do not want to sit through the extreme pending volatility. The announcement will basically make or break this setup in a big way.
