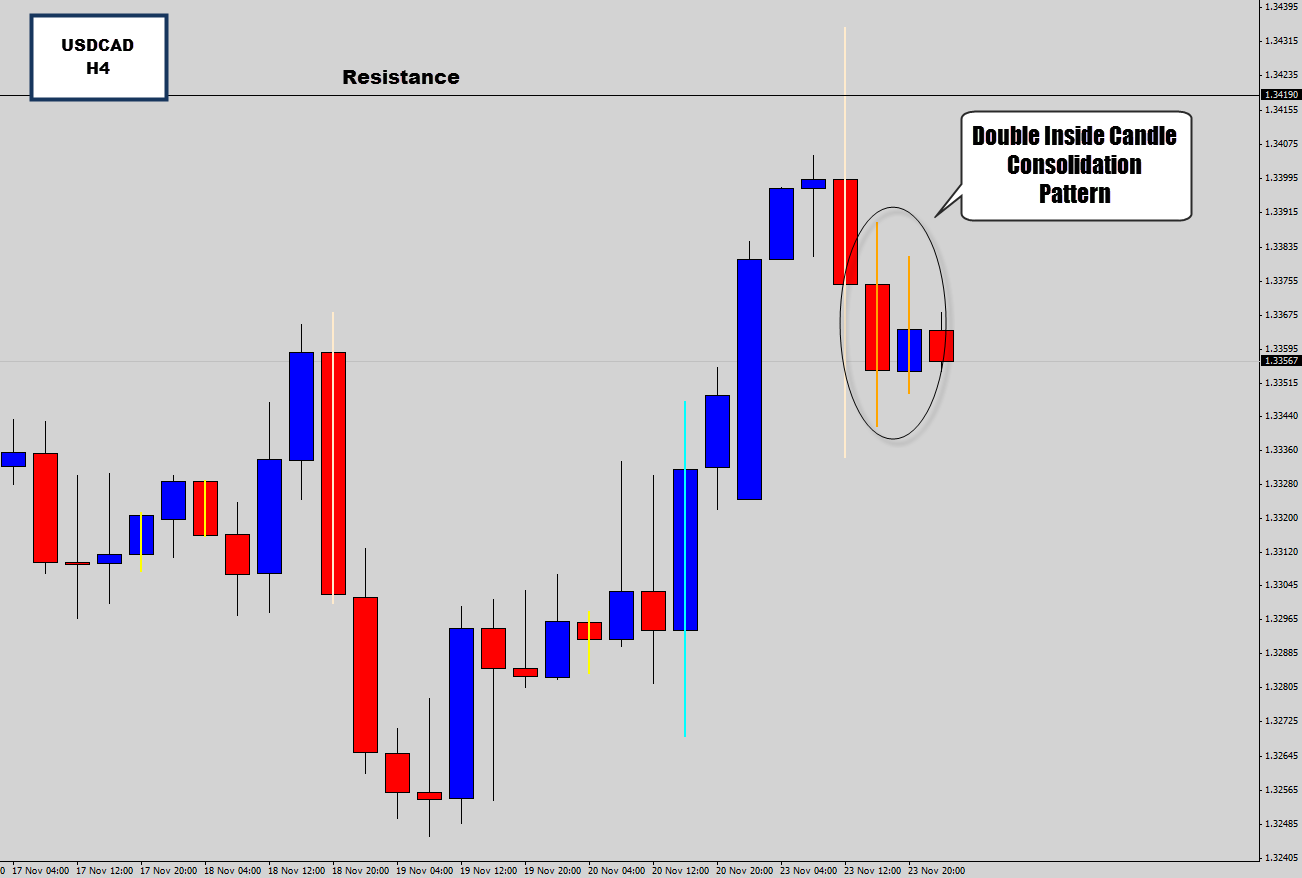
Looking at the USDCAD which has got my attention here as it hits a potential turning point here. Last time the market failed at this level we seen a 500 pip drop on the daily chart.
The market tested this level last session, but higher prices were rejected again for a second time at this level. If we get a repeated response there could be a decent move off this level.
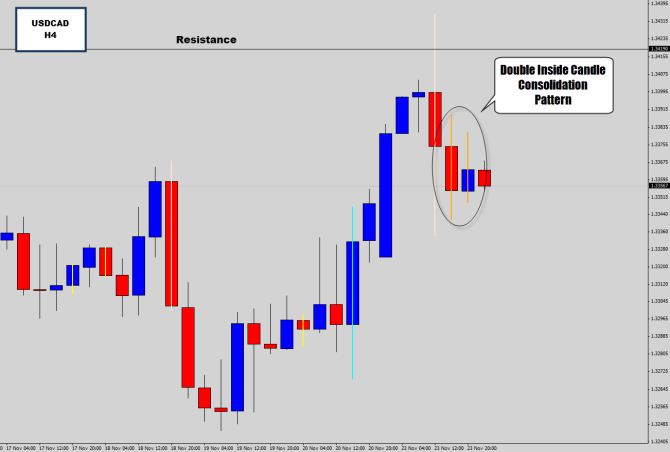
My Price Action Battle Station algorithm send me a notification on my iPhone about a double inside candle setup on the 4 hour chart – which I seen when I got up this morning. So I checked out the setup, and there is potential for a breakout here.
I don’t normally worry about inside candles on the 4 hour – but double inside candles (marked in orange) seem to have a much better success rate. The main factor here is the major resistance level acting as a potential turning point. There isn’t anything to work with on the daily chart – but a downside breakout could be triggered as price moves below the double inside candle setup on the H4 chart.
Because this pair generally moves the most in the New York session, it would probably be best to avoid taking any breakout style trades until the US session does open to avoid getting caught in early breakout traps.
