Fundamental Analysis:
Canadian GDP data surprised the market with growth of 0.3%.
Labor market reported stronger than expected.
Sharp increases in Oil Prices after OPEC meeting underpin the Canadian dollar.
Current week BOC monetary policy and Trade data is in focus.
BOC policy likely to remain unchanged and would wait for the FOMC meeting. Trade data could bring a surprise as a further recovery in exports is plausible.
Technical Analysis:
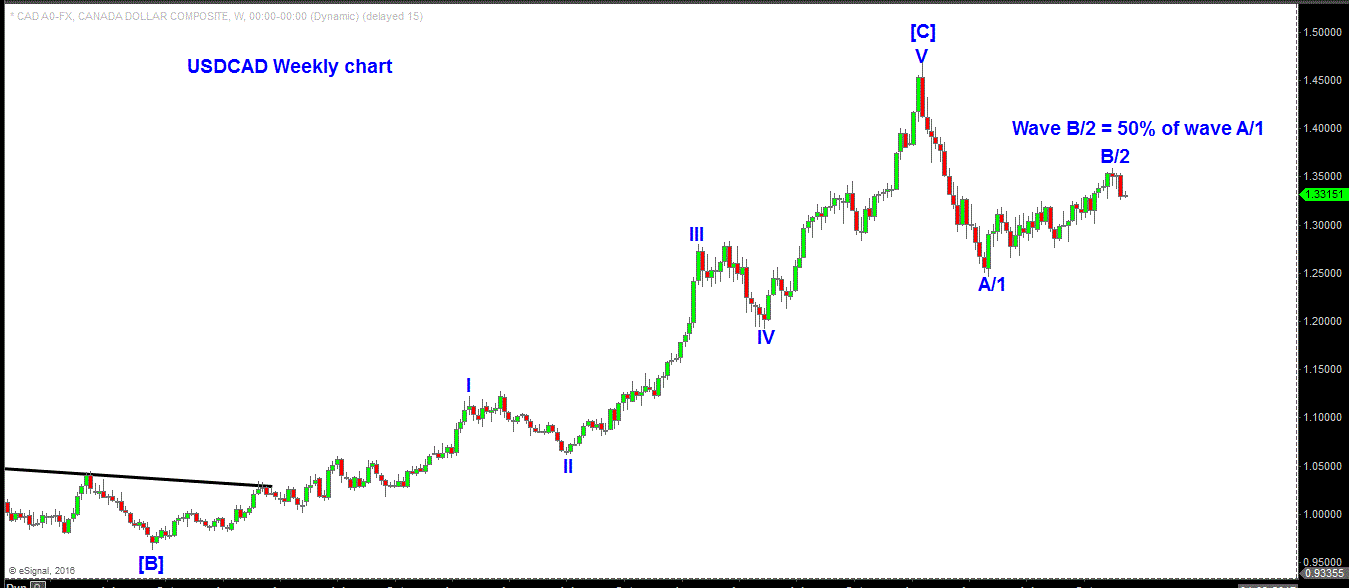
As seen above in weekly chart the pair has retraced 50% of previous wave A/1 and formed the big bearish candle and closed on a negative note in the previous week.
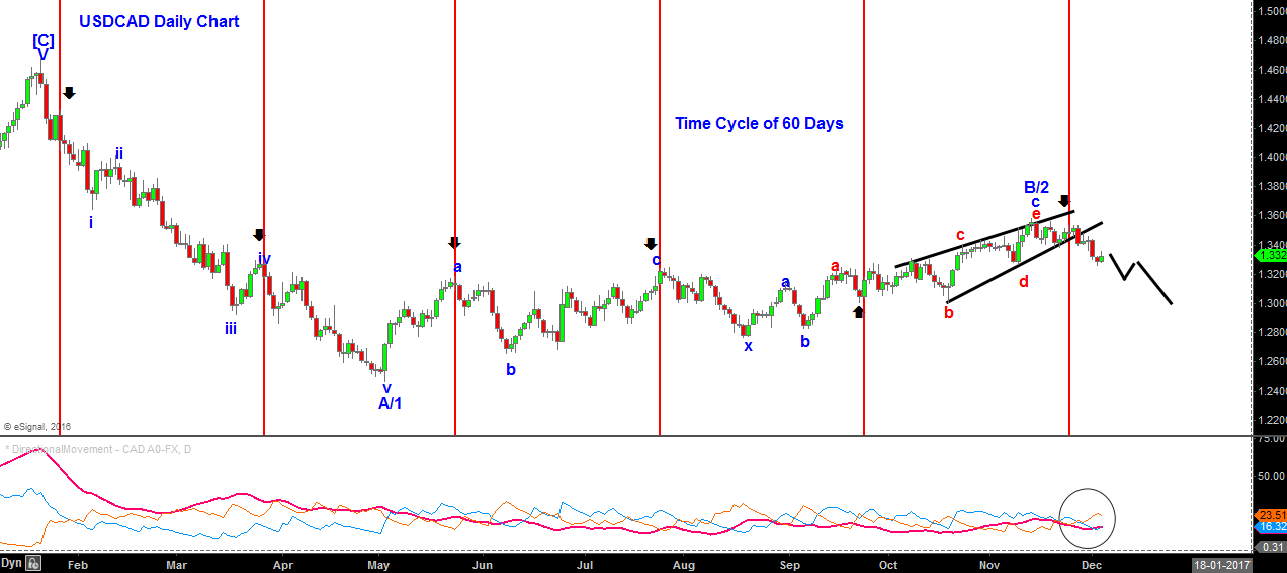
On the daily chart, The Cycle of 60 days working very well. Since Feb 2016 the pair has followed the cycle and formed top after 2 months, except one time i.e. in September 2016.
Recently, the pair has followed the cycle, formed the top and breached the ending diagonal pattern on downside accompanied by kink up in ads indicator.
In short, as long as the pair sustain below the resistance of 1.3530 levels bias is negative for the pair and it could move lower towards the 1st support of 1.3200 or even lower towards 1.3000 levels.
USDCAD Weekly Chart

USDCAD Daily Chart


