GBPUSD Trading Setup
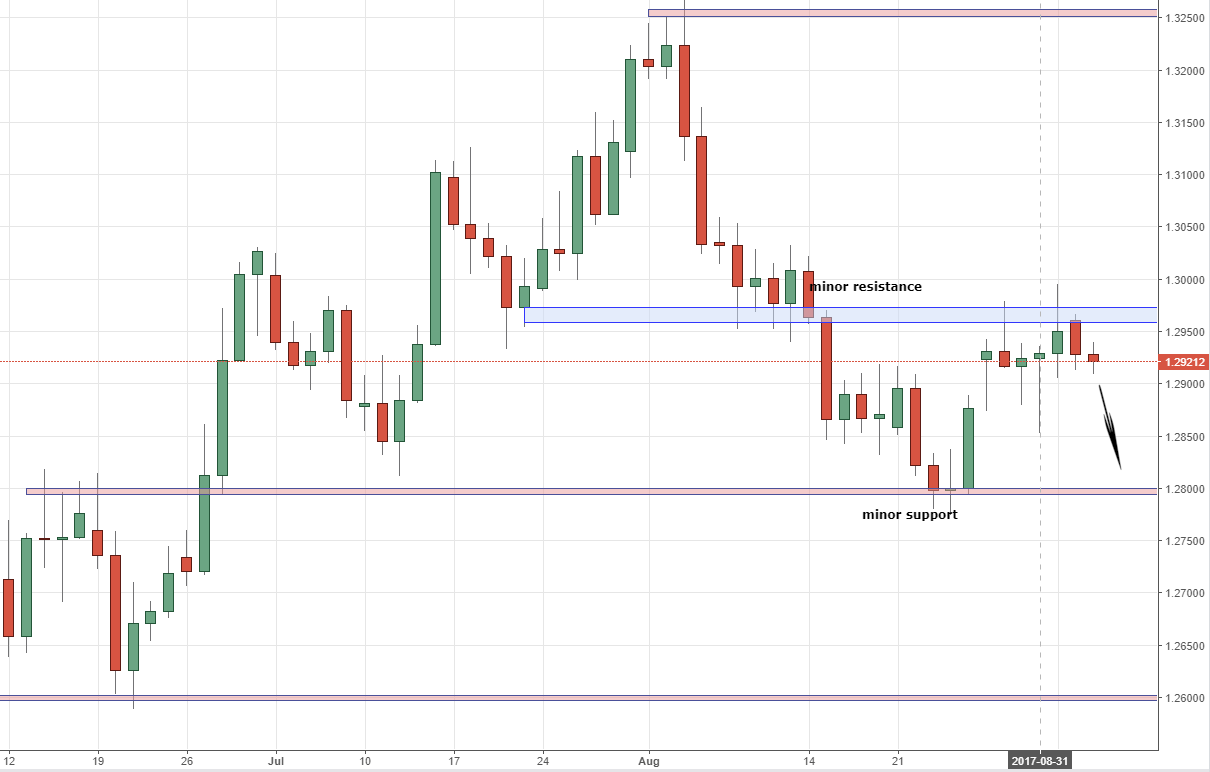
Today I am looking at the GBPUSD pair. It seems like the daily chart looks ready to take a break. Price action is showing us first two bullish rejection candles- one of them is a pinbar. The candle from yesterday is a bearish engulfing candle.
Additionally, the price is residing just below minor resistance area. The inability of price to break through this resistance level, for the time being, indicates more bearish connotations.

I am curious to look deeper and check the 4 hour chart. We might find further evidence of bearishness there.

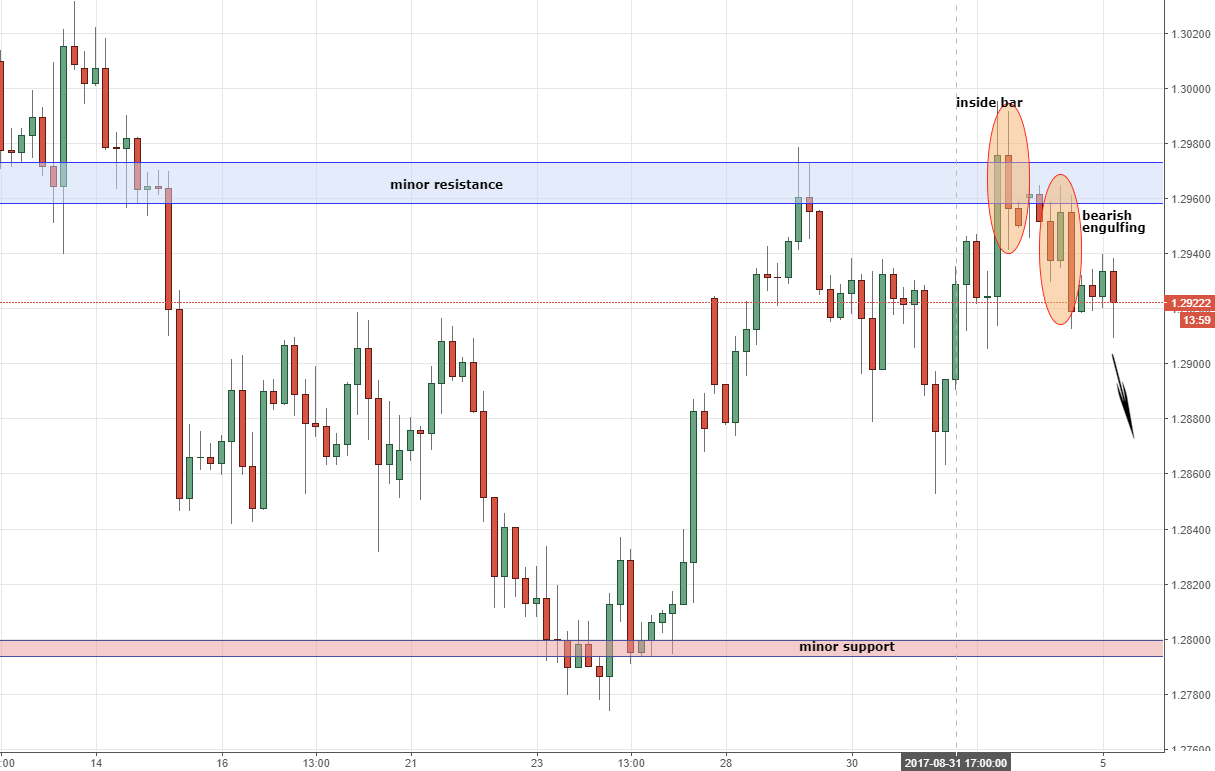
The 4-hour chart is showing us more bearish mood. There was an inside bar that formed on the minor resistance area. It was followed by a bearish engulfing pattern.
It seems like the way is clear in front of the price. I am seeing the next support level to be the level of 1.2860.
The secondary support level is 1.2800.
I will also be cautious and if the price goes above 1.30. This would indicate that the bullish mood is back and that price might continue rising up to the level of 1.330, which is the next major resistance area.
Happy Trading,
Guest post by Colibri Trader
