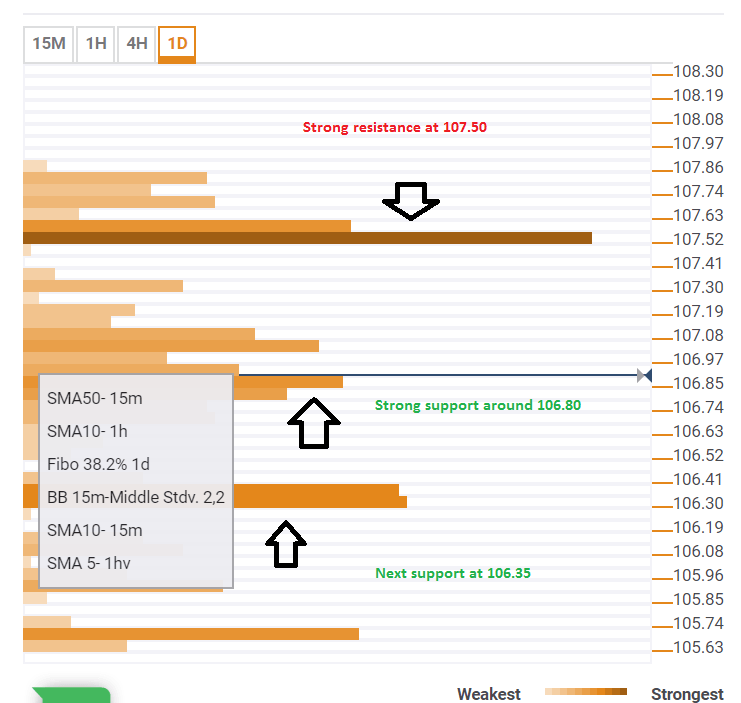
The Technical Confluences Indicator shows that the USD/JPY has lots of support at around ¥106.80. This area is the convergence of the Fibonacci 38.2% one-week, the Bolinger Band 15m Lower (Stdv. 2.2), the SMA5-4h, the Bolinger Band 1h-Middle, the SMA200-1h, the SMA50-4h, and the Fibonacci 23.6% one-day.
On the other hand, there are only weaker and sparser technical resistance levels on the way up. The notable are is ¥107.50, where we find a small but powerful cluster of resistance levels: the one-month high, the one-week high, the Pivot Point one-month R1, and the Pivot Point one-day R2.
Looking down, the next congestion of support levels is relatively close at ¥106.35 where the following lines meet: the SMA200-4h, the Bolinger Band one-day Middle, the SMA100-4h, the Pivot Point one-day S2, and the Fibonacci 61.8% one-month.
All in all, the path of least resistance is to the upside as the downside is packed with significant support levels.
Here is how it looks on the tool:
Confluence Detector
The Confluence Detector finds interesting opportunities using Technical Confluences. The TC is a tool to locate and point out those price levels where there is a congestion of indicators, moving averages, Fibonacci levels, Pivot Points, etc. Knowing where these congestion points are located is very useful for the trader, and can be used as a basis for different strategies.
This tool assigns a certain amount of “weight” to each indicator, and this “weight” can influence adjacents price levels. This means that one price level without any indicator or moving average but under the influence of two “strongly weighted” levels accumulate more resistance than their neighbors. In these cases, the tool signals resistance in apparently empty areas.
Learn more about Technical Confluence