- Cryptos kick off the week with a kick lower on some negative headlines.
- The technical charts continue challenging digital coins.
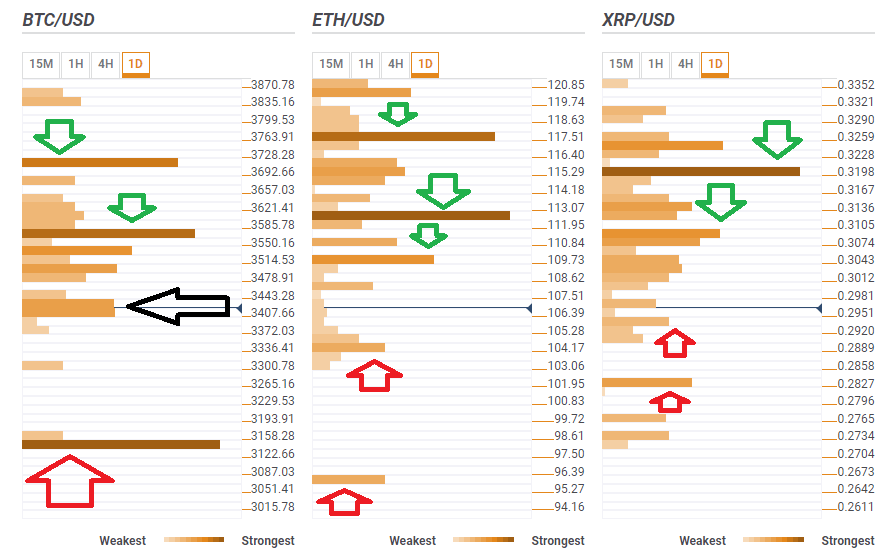
- Here are the levels to watch according to the Confluence Detector.
Cryptocurrencies are on the back foot, losing some ground in the wake of the new week. These are not plunges, but they are certainly discouraging and worse than the mini flash crash seen exactly one week ago.
Why are cryptos falling? There are several negative headlines.
Jan van Eck, the person behind Van Eck that has applied for a Bitcoin Exchange Traded Fund, said that previous crypto investors are now pouring into gold. He cited a poll that his firm did among $4,000 Bitcoin investors. They focus on the precious metal as the primary investment for 2019.
Tone Vays goes even further and sees a price of $1,300, close to what analysts at JP Morgan see for the grandaddy of cryptocurrencies. They said the value is “unproven” and set a low target of $1,260.
Not everybody is pessimistic though. Mike Kayamori sees a rechallenge of the highs around 20K before 2020. He is a darling of those who Hold On for Dear Life, HODLers.
The technical picture does not look too good either.

BTC/USD has growing resistance
Bitcoin is struggling around $3,425 where we see the confluence of the Bollinger Band 1h-Lower, the Simple Moving Average 5-15m, the Pivot Point one-month Support 1, last week’s low, the Pivot Point one-week Support 3, the Fibonacci 23.6% one-month, the BB 15min-Lower, and more.
If Bitcoin moves up, the next hurdle is around the $3,550 area where we see a cluster including the SMA 5-1d, the SMA 50-4h, the SMA 200-1h, the Fibonacci 38.2% one-month, the SMA 100-15m, the SMA 10-4h, the Fibonacci 61.8% one-day, and the Fibonacci 38.2% one-week.
The upside target is $3,810 which is the convergence fo the PP one-week R1, last week’s high, and the SMA 200-4b.
On the downside, the picture is quite frightening for BTC/USD. Significant support is only around $3,137 where we see a juncture of potent lines including the Pivot Point one-month Support 1, last years’ low, and the previous month’s low.
ETH/USD does not have a lot of support
Ethereum has some support at around $104 which is the meeting point of the PP one-week Support 3 and the PP one-week Support 2. These are not very significant technical lines.
The next cushion is only at $96 where the PP one-month Support 3 awaits.
On the other hand, resistance the ETH/USD price is quite significant. At $109 we find the confluence of the Pivot Point one-month Support 1, the PP one-day S1, and the SAM 50-15m.
Further above, $112 is a convergence including the Fibonacci 61.8% one-month, the Fibonacci 38.2% one-day, and the SMA 100-15m.
The path to the upside is a minefield dotted with lines and the most notable resistance is at $117.50 where we see the Fibonacci 38.2% one-week and the Pivot Point one-day R2 converge.
All in all, Vitalik Buterin’s brainchild’s path of least resistance is to the downside.
XRP/USD a hard road to a hard barrier
Ripple remains restricted at around $0.32. This has not changed. The round number is a juncture including the SMA 10-one-day, the Fibonacci 38.2% one-week, the Fibonacci 161.8% one-day, and the PP one-day R2.
Ripple faces multiple areas of resistance on the way up with another noteworthy barrier at $0.3085 where we find the confluence of the SMA 200-15m, the SMA 50-1h, last week’s low, the Fibonacci 61.8% one-day, the Fibonacci 38.2% one-day, and the SMA 10-4h.
Support lines are far and few between. $0.2935 where we see the BB 15m-Lower and the PP one-week S2 converge.
The most considerable cushion is at $0.2827 where we see last month’s low.
Similar to Ethereum, Ripple’s path of least resistance is not going against resistance.
More: Crypto analysis: Don’t fear the reaper
Get the 5 most predictable currency pairs
