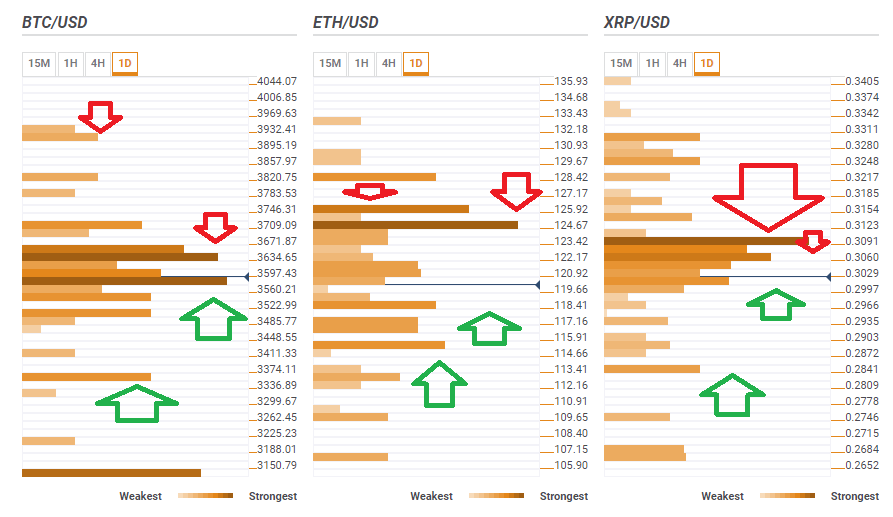
- is After bottoming out, cryptocurrencies consolidated in range.
- They now seem to face significant resistance and may fall before resuming the rises.
- Here are the levels to watch according to the Confluence Detector, our proprietary tool.
Ethereum led the rise of cryptocurrencies from the lows, Ripple enjoyed it as well, and Bitcoin also moved a bit higher. After consolidating, Bitcoin is best-positioned, or better said: the least badly-positioned. Confluences of technical levels point to considerable resistance lines and not that much support at this point.
All in all, things may get worse before they get better as the Crypto Confluence Detector shows.

BTC/USD locked in a narrow range
Bitcoin has support at around $3,580 where we see a dense cluster including the Bollinger Band 15-minutes lower, the Pivot Point one-day Support 1, the BB 4h-Lower, the Fibonacci 38.2% one-week, the Simple Moving Average 5-one-day, the SMA 5-10, the SMA 50-15m, the BB 15min-Middle, the SMA 10-1h, the SMA 5-1h, the SMA 5-15m, the SMA 10-15m, and the BB 1h-Middle.
Resistance at $3,634 is also substantial, but marginally less robust. We see the juncture of the Fibonacci 23.6% one-week, the Fibonacci 61.8% one-day, the PP 1d-R1, the Fibonacci 38.2% one-month, the BB 4h-Upper, the SMA 50-1d, and yesterday’s high.
Beyond these levels, BTC/USD has quite a lot of room to rise and also fall. It could shoot up to $3,910, where we see the meeting of the PP 1w-R2 and the PP 1m-R1.
Or it could fall to $3,355 which is last month’s low.
All in all, there is little room to move, but with a bit more to the upside.
ETH/USD capped at $124.67
Ethereum is the big winner of Friday’s rally but may have run out of steam. Vitalik Buterin’s brainchild faces fierce resistance at around $124.57 where the PP 1d-R1 and the BB 1d-R2 converge.
Further resistance is very close: at $125.92 we see the confluence of the Fibonacci 38.2% one-month and the previous day’s high.
Some support awaits at $118.41 which is the convergence of the SMA 5-1d and the Fibonacci 23.6% one-week.
Further down, ETH/USD has support around $115, where we see the Fibonacci 38.2% one-week.
The path of least resistance is down, but with more room to move than Bitcoin.
XRP/USD hard cap
Ripple faces a wall of resistance at $0.3060, where we see the Fibonacci 38.2% one-day, the BB 4h-Middle, the SMA 5-1d, and the SMA 100-1h converge.
And the wall gets even thicker at $0.3091 which is a cluster including the PP one-day R1, the Fibonacci 38.2% one-week, the Fibonacci 23.6% one-month, the BB1d-Middle, and the Fibonacci 61.8% one-day.
Looking down, Ripple has only weak support around the round number of $0.3000. The confluence consists of the SMA 200-1h, the SMA 50-4h, the Fibonacci 61.8% one-week, the SMA 50-15, the SMA 10-1h, and the BB 1h-Middle.
The downside target is $0.2840 which is last month’s low.
Get the 5 most predictable currency pairs
