The price of Gold in USD (XAU/USD) extended its gains and hit a high of $1,322.48, the highest since February 28th. The precious metal continues shining into the new week after recovering beforehand.
Gold rising on recession risk
The most recent driver of Gold is related to fears about a US recession. These concerns stem from the temporary inversion of the yield curve. On Friday, the US 3-month yield dropped below the 10-year return for the first time since 2007. In the past, such inversions marked an upcoming recession.
The plunge in German manufacturing PMI was fuel to the fire on the dovish Fed decision. While the US central bank supports markets, its reluctance to raise rates caused markets to think that things are set to get worse.
Will this time be different? Perhaps. Central banks are holding an unprecedented amount of bonds and pushing yields lower. The signal may be false. Nevertheless, if markets believe that the inversion represents a recession, it may become a self-fulfilling prophecy.
Gold is seen as a safe-haven or a hedge against worsening conditions. Gold does not have any yield, but if yields of bonds are falling, gold has an advantage in addition to the rising price.
More:
Gold Technical Analysis – Levels to watch

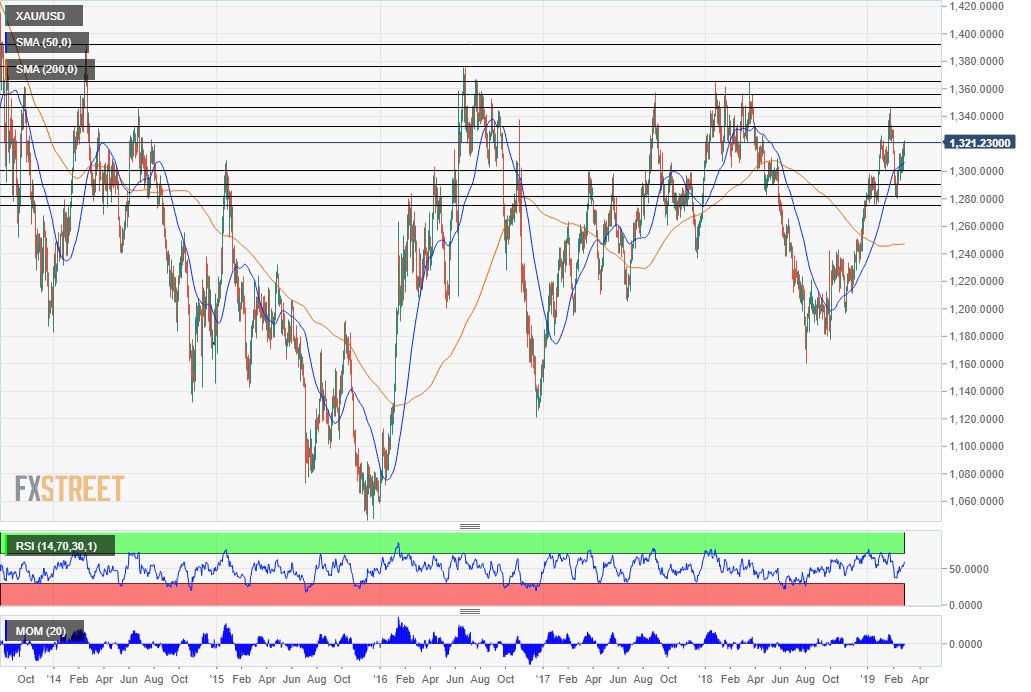
We are using the daily chart but looking at a broad horizon. The first levels have been seen recently while others date back to 2016.
$1,333 held the yellow metal down in late February and served as a stepping stone on the way down. The next line is also from the recent past: $1,346 was the peak on February 20th and the highest level since April 2018.
$1,356 was a double top in April and March last year. It is followed by another potent cap which was a triple-top: $1,365 was a peak in April and in January last year as well as in August of 2016.
Even higher, the July 2016 high of $1,375 is the next level to watch. The next peak is from February 2014, over five years ago. That was $1,392.
Further up, $1,429 dates back to August 2013 and $1,487 to April that year.
Support is found at the round number of $1,300, at $1.281, and at $1,275. All have been stepping stones on the way up.
Get the 5 most predictable currency pairs
