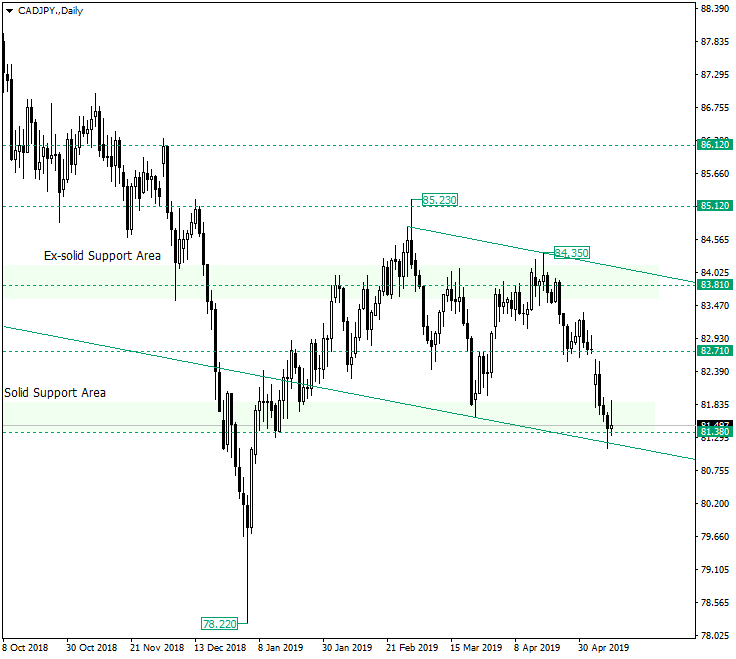
The Canadian dollar versus the Japanese yen currency pair is now at the important support level of 81.38, an area which could have already given sings of weakness, but it could also turn out to still be the support everyone is expecting it to be.
Long-term perspective
After the appreciation from 78.22, the price formed what could turn out to be a bullish angled rectangle, with the highs at 85.23 and 84.35 and lows at the support area of 81.38. The first low was printed on March 23, 2019, while the second low already is a lower low.
This latter low could be seen as favorable for both the bears and the bulls. The bears could state that, being a lower-low, May 9, 2019, had poised the pair to further decline. On the other hand, the bulls could argue that this is a solid support area and that the lower low is actually in their advantage, because it resembles the bullish angled rectangle which is — of course — a bullish continuation pattern. And by looking at the chart one can see that the pattern has something to continue: the rally that began from 78.22.
So, as long as this solid support area holds, the possibility of an appreciation is quite high and, of course, can materialize in the form a false break of the support area and / or a bottoming pattern just above 81.38.
Short-term perspective
The pair is declining and as long as the price confirms each level as a resistance the profile remains bearish, targeting 80.64. But, in the light of those discussed for the long-term perspective, any resistance that turns into support could sign a change in the market profile, with each subsequent resistance levels — 91.77, 82. 43 and so on — turning into support levels.
Levels to keep an eye on:
D1: 81.38

H1: 81.11 80.64 81.77 82.43
If you have any questions, comments, or opinions regarding the Technical Analysis, feel free to post them using the commentary form below.
