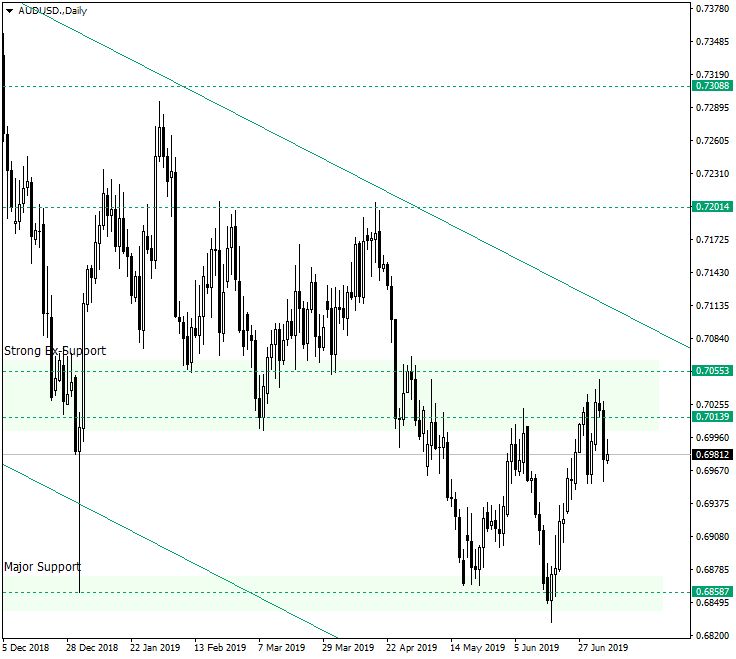
The Australian dollar vs. the US dollar is quietly preparing an ascent while evolving casually in the descending channel that began a year ago.
Long-term perspective
The pair is in a descending trend, the resistance line of which can be drawn by uniting the highs of July 8, 2018, and December 3, 2018, respectively. Besides the resistance line, two major areas that keep the price in check are the strong ex-support area of 0.7053 and 0.7013 and the major support of 0.6858.
On May 23, 2019, the price confirmed the major support and rallied towards the ex-support. This could have been considered a throwback that would confirm the ex-support as resistance and continue the downwards move, pierce the major support, and make a new low at a considerable distance from the pierced level.
But it turned out that instead of successfully piercing it, the price was able to only materialize a false break, a break that led to a rally and a higher high — if 4th of July is to be compared with 7th of June.
In this state of matters any new leg down will only attract new buyers, eyeing the piercing of the 0.7053 — 0.7013 area.
Short-term perspective
Exploring the direction given by the daily chart by means of the H4 chart, plotting a Fibonacci retracement (from the low of 18th June to the high of 1st of July) shows how well the price respected the 23.6 level and also highlights the technical 0.6935 as it corresponds with the 50.0 level, a level that is the favorite one to be targeted by corrections.
So, as long as the price is confirming as support the 38.2 or, better, the 50.0 Fibonacci retracement levels, further advancement is to be expected, with targets such as 0.7003 and 0.7047 for the H4 chart and 0.7100, followed by 0.7201, for the daily chart.
Levels to keep an eye on:
D1: 0.7053 0.7013 0.7100 0.7201

H4: 0.6935 0.7003 0.7047
If you have any questions, comments, or opinions regarding the US Dollar, feel free to post them using the commentary form below.
