Crude oil jumped towards 63.00 zones and tested the upper side of a 2019 trading range where upside was limited, and a new leg lower started developing. We labeled that same leg down as wave D, as part of a bigger complex correction, which fully developed and pushed the price into the final leg E of a triangle structure, towards the 57.00 regions. Potential resistance/bearish turn for oil can now be near the 58.0/59.50 zone.
Crude oil, daily
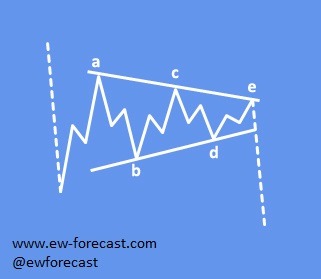
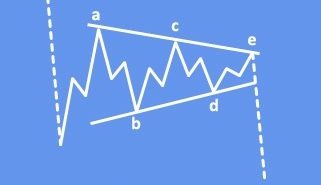
 A Triangle is a common 5-wave pattern labelled A-B-C-D-E that moves countertrend and is corrective in nature. Triangles move within two channel lines drawn from waves A to C, and from waves B to D. A Triangle is either contracting or expanding depending on whether the channel lines are converging or expanding. Triangles are overlapping five wave affairs that subdivide 3-3-3-3-3.
Triangles can occur in wave 4, wave B, wave X position or in some very rare cases also in wave Y of a combination.
Elliott wave triangle in a bear market:

Trade well,
The EW-Forecast team.
Get the 5 most predictable currency pairs
Oil: Interesting Elliott Wave Triangle pattern Points Lower
