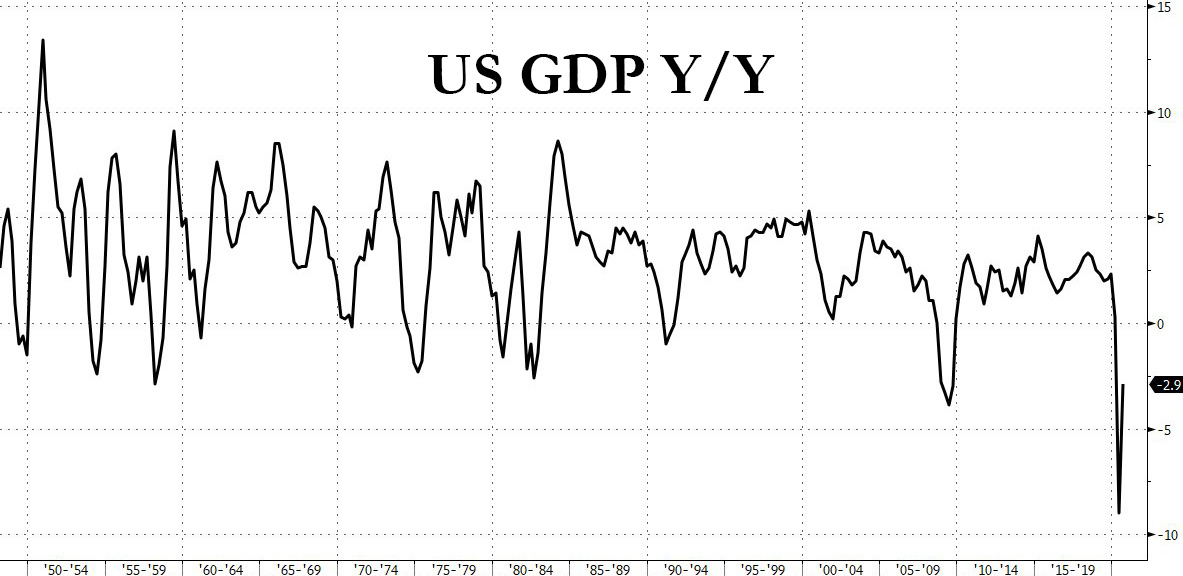
The best quarter in history – following the worst one. Gross Domestic Product jumped by an annualized rate of 33.1%, above expectations. That included a surge of 40.7% in personal consumption, a core component of the economy. Business spending is up over 23% after crashing 27%.
The impressive statistics come after the crash. The US economy crashed by 31.4% annualized in the second quarter, a result of the covid-related lockdowns. It came on top of a 5% stumble in the first three months of the year, when the disease was only beginning to lift its head.
In quarterly terms, the world’s largest economy fell by -10.1% in the first half of the year and now rose by 7.4%. That means that there is still some 3% to reach pre-pandemic levels – and more to reach the levels of activity had the economy continued growing at its moderate 2-2.5% pace.
The chart below provides a graphic representation of the situation:

Moreover, markets have moved on from the three months that ended in September to October and the colder months ahead. European countries are entering new forms of lockdowns as COVID-19 cases rage and figures are rising also in the US. Worries about a second American wave are already hurting markets and they may continue.
Things are moving fast in the coronavirus era, making even the quickly-released first release of GDP a lagging indicator.
Overall, the best quarter in history gives few reasons to be cheerful.
The data is released just five days ahead of the all-important US elections. President Donald Trump will likely tout the outstanding figure, despite the fact that it only represents a rebound from a crash – and not a V-shaped recovery. Will it impact voters? Around 75 million Americans – 55.5% of the total vote count in 2016, so there is less room for impact.
More: How three US election outcomes (and a contested result) could rock the dollar
Get the 5 most predictable currency pairs
US GDP Analysis: No V-shaped recovery despite 33.1% leap, covid looms over markets
