The Canadian dollar had quite a few volatile days, with ranges of over 200 pips. What’s next for the loonie?
The team at Morgan Stanley selects Dollar/CAD on 3 technical charts and points to the upside:
Here is their view, courtesy of eFXnews:
Morgan Stanley picks USD/CAD as its technical FX chart of the week, where MS is bullish and runs a long trade in its strategic portfolio. MS outlines the important levels where traders could consider entering a long position and place their stops.
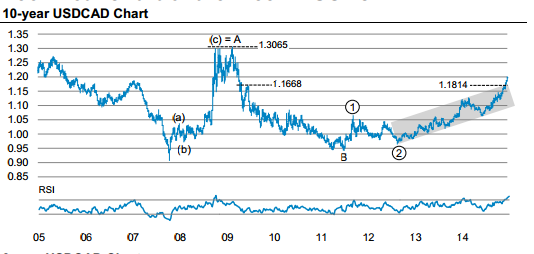
On the 10-year USDCAD Chart:
“Having retraced over the 61.8% level of the decline from 2009, the uptrend in USDCAD remains intact. Currently in a C-wave, we would expect completion of the wave above 1.3065, the A-wave top. USDCAD has recently broken out of the top end of the trend channel at 1.1814 suggesting further upside from here,” MS projects.

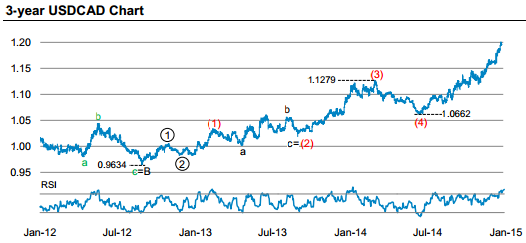
On the 3-year USDCAD Chart:
“USDCAD is currently within a strong upward trending move since the 3 rd wave began from a low of 0.9634. The sub-structure shows that we a are currently in a bullish (5)th wave. The (4) th wave retraced to the 38.2% level of the (3) rd wave. We expect the current uptrend to remain intact,” MS adds.

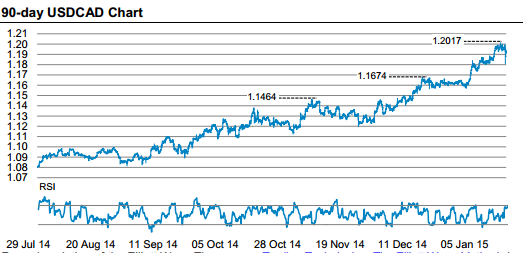
On the 90-day USDCAD Chart:
“The recent USDCAD chart here shows the appreciation as part of the (5)th wave. While we remain bullish, we believe that any loss of momentum of the current uptrend, breaking the previous high around 1.1674 could cause a move lower in USDCAD. We would therefore suggest buying USDCAD around current levels and keeping a stop around 1.16,” MS advises.

The trade:
In its strategic portfolio, MS maintains a long USD/CAD position from 1.1810 targeting 1.25, with a stop at 1.15.
For lots more FX trades from major banks, sign up to eFXplus
By signing up to eFXplus via the link above, you are directly supporting Forex Crunch.
