After AUD/USD lost critical support and reached a near 3 year low (see the 7 reasons for the Aussie crash), its next levels are those seen back in 2010.
Here are the next levels to watch for.
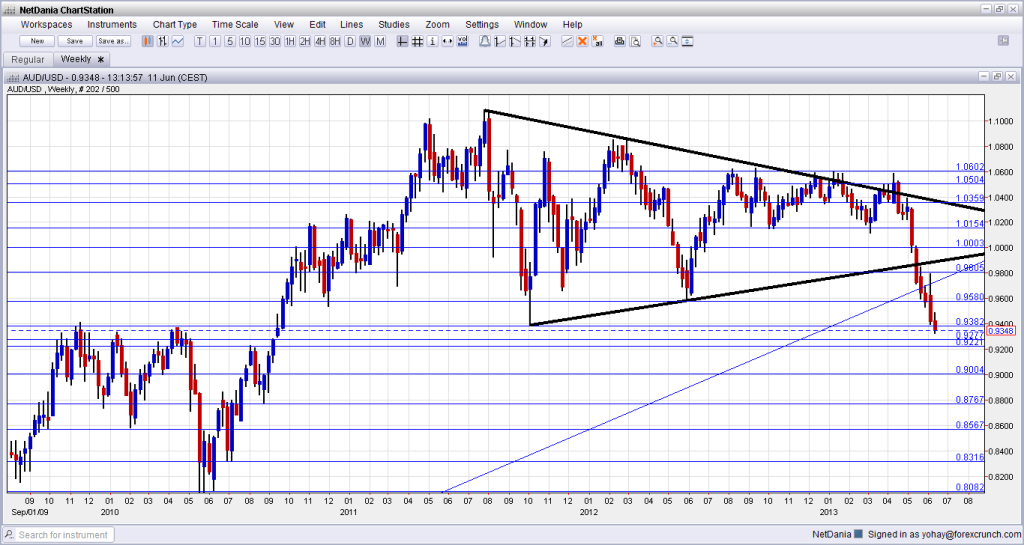
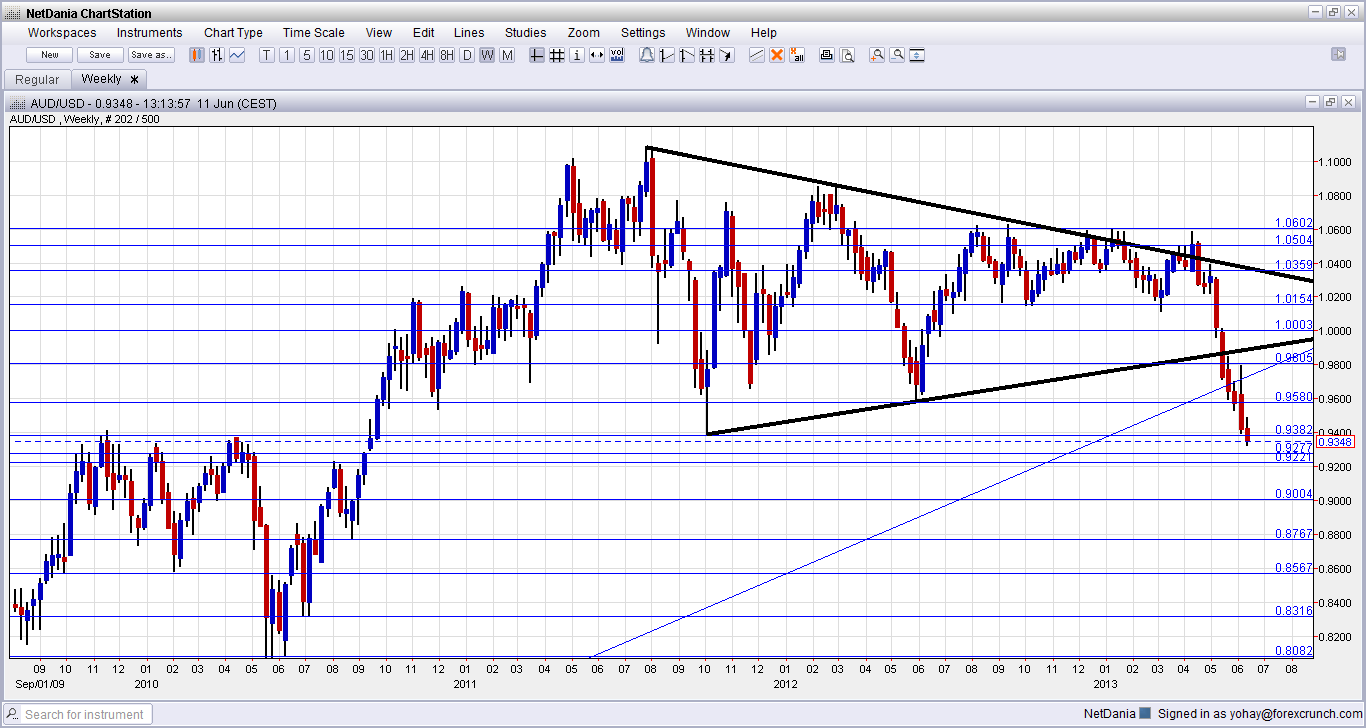
0.9388 was not only the swing low of October 2011, but the pair also had trouble breaking above this area during 2009 and 2010. It can be seen on this weekly chart, which looks back down September 2009. The next levels are close:

AUD/USD already fell as low as 0.9324. The next support line is at 0.9277, which capped the pair back in 2009. It is followed by 0.9220, which stopped the Aussie on its way up in mid 2010. This triggered a big correction before the next move.
The round number of 0.90 provided support at the beginning of 2010 and is also eyed by quite a few analysts. Further below, 0.8787 was a swing low in late 2010 and also slowed the pair down in 2009.
Below, 0.8567 was a bottom at the beginning of 2010 and it stands out in the graph. Even lower, 0.8316 worked as a bottom in mid 2010.
The last line on the long term chart is at 0.8080: the Australian dollar found a low at this point more than once in 2010. From this line, above the round 0.80, AUD to USD began a big move higher.
For more short term lines, events and analysis, see the AUDUSD forecast.
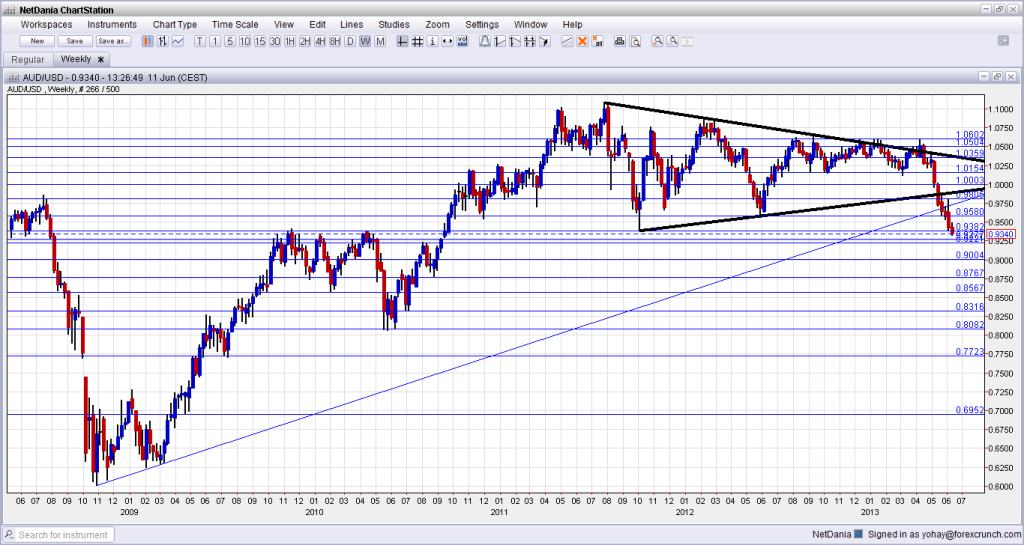
Last thing: here is the even bigger picture – the same chart starting in mid 2008. Note the trend line rising from the 2008 lows around 0.60 and formed at the beginning of 2009. As the chart shows, this line was broken in recent weeks.

