John Forman is a Forex author and expert. He is the Senior Foreign Exchange Analyst for the IFR Markets group of Thomson Reuters and frequent blog poster on Currensee.com.
Do you know the seasonal patterns which tend to play out in the forex markets? If so, then you were well positioned to take advantage of what we saw out of the likes of the dollar and the euro over the last couple of months. Both moved in accord with their historical tendencies during January and February.
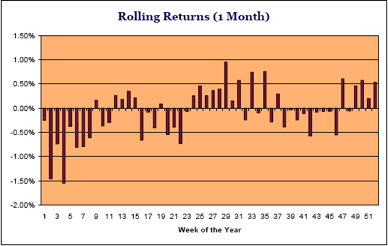
Take a look at as this chart of how EUR/USD tends to perform throughout the course of the calendar year.

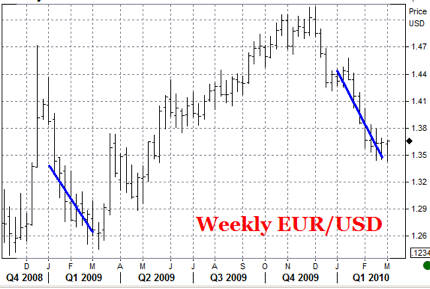
What the chart is telling you is that if you sell EUR/USD during the first 8 weeks or so of the calendar year, and hold that position for a month, you will generally make month. The chart includes data for 1997 to 2008 (pre-1999 data is from the old ECU to which the EUR was pegged at its launch). It doesn’t include 2009 and 2010, which would make things even more negative as the chart below shows.

And here all the market commentators were talking about what was happening with Greece as the main driver of the decline in EUR/GBP the last couple months. While that certainly was contributory, there’s no denying that January and February have a seasonal tendency to move lower anyway. The current news and psychology in the market has been riding along the seasonal pattern.
So where to from here?
Well, the dollar tends to stay on the positive side through about the first quarter of the year, though the latter part of that span is not quite to strong as what is seen in the first two months. As we progress toward the middle part of the year the dollar takes on a comparably negative bias as the positive one seen at the outset of the year.
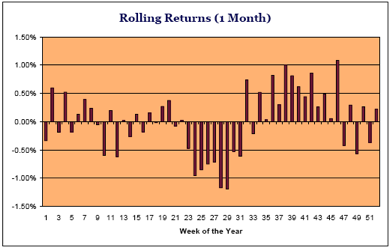
Look at what’s forthcoming in USD/JPY.

Week 23, which falls in June, is about the start of 2-3 month stretch over which USD/JPY tends to perform badly. That wouldn’t be a time one generally is going to want to be long.
A little more immediate is the strong tendency for GBP/CHF to rally in the month of April. Between 1982 and 2008 the cross was up 70% of the time at an average rate of 1.73%. Overall, the cross has averaged a gain of 0.78% during the month. And those figures don’t include a 3.3% gain GBP/CHF experienced in 2009.
There are loads more seasonal patterns in the majors and major crosses, from monthly down to daily. Don’t ask me to tell you why they persist. I can only hazard a guess about what the drivers may be, but really I’m just reporting what the numbers say. And you definitely should be aware of these patterns. You’re not going to base your trading decisions on them alone, but they may help you improve your trading odds by biasing you in the right direction.
The data above comes from the research report Opportunities in Forex Calendar Trading Patterns, which I put together after I started noticing these patterns while I was doing my own trading. I have definitely used them profitably since.
=====
Be sure to read the full risk disclosure before trading Forex. Please note that Forex trading involves significant risk of loss. It is not suitable for all investors and you should make sure you understand the risks involved before trading. Performance, strategies and charts shown are not necessarily predictive of any particular result. And, as always, past performance is no indication of future results.
