- The Confluence Detector shows clusters of technical levels according to their importance.
- Bitcoin is looking bullish, Ethereum is looking for a direction, while Ripple is vulnerable.
BTC/USD path of least resistance is up
The price of Bitcoin (BTC/USD) extends its gradual recovery. Can it continue higher?
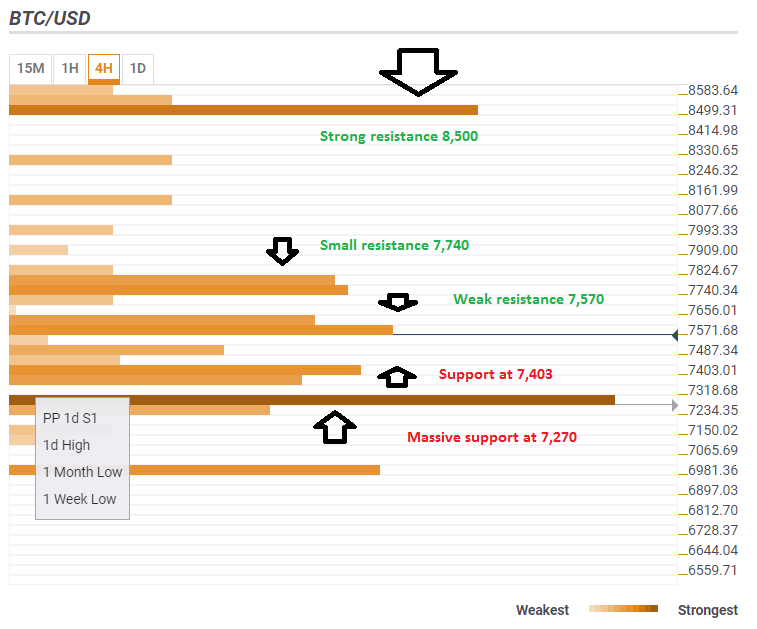
The Technical Confluence Detector shows that the digital coin has more room to the upside than to the downside. A confluence of some technical lines awaits at $7,570. This is the meting point of the Simple Moving Average 5-1h, the Pivot Point one -day R1, the SMA 5-15m, the SMA 10-15m, and the SMA 10-one day.
The next hurdle is at $7,740 which is the convergence of the Fibonacci 61.8% one-month and the Fibonacci 161.8% one-day.
However, the most significant cluster of potent resistance lines awaits only around $8,500. This is the meeting point of the Fibonacci 48.2% one-month, the Simple Moving Average 50 one day, the SMA 200-4h, and the SMA 100 one day, all strong lines.
On the downside, support awaits at $7,403 which is a cluster that consists of the 4h-high, the Fibonacci 38.2% one-day, the SMA 5-4h, and the Bolinger Band one-hour Middle (Stdv. 2.2).
The most robust support line is at $7,270 which is the confluence of the Pivot Point one-day Support 1, the one-day high, the one-month low, and the one-week low.
All in all, there is more room to the upside than to the downside.
This is how it looks:
ETH/USD is within a $36 range
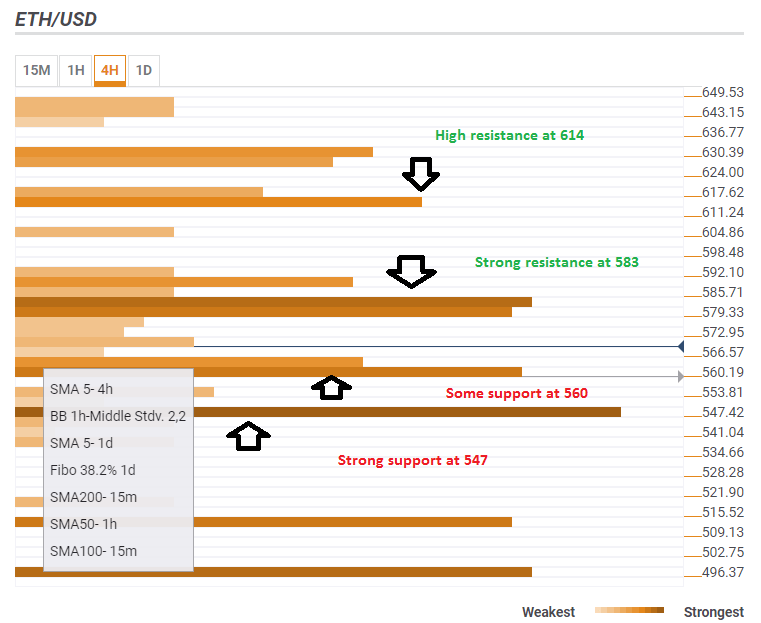
The Confluence Detector sees clear battle lines for Ethereum (ETH/USD). The cryptocurrency faces fierce resistance around $583. This is the convergence of the Fibonacci 38.2% one-month, the Bolinger Band 1h-Upper (Stdv. 2.2), the BB 15m-Upper, and the powerful Pivot Point one-day Resistance 1.
Further above, $614 is the confluence of the Fibonacci 161.8% one-day and the Fibo 38.2% one-week. This cluster is not as strong as the previous one. So, a break above $583 could unleash the upside.
On the downside, $560 is a significant line of support with the congestion of the Simple Moving Average 5-4h, the BB 1h-Middle, the SMA 5-1d, the Fibonacci 38.2% one-day, the SMA 200-15m, the SMA 50-1h, and the SMA 100-15m.
The next level to watch is $547 which consists of the Bolinger Band 1h-Middle, the one-month low, and the one-week low.
All in all, ETH/USD is trading within the $547-$583 band.
XRP/USD on unstable ground
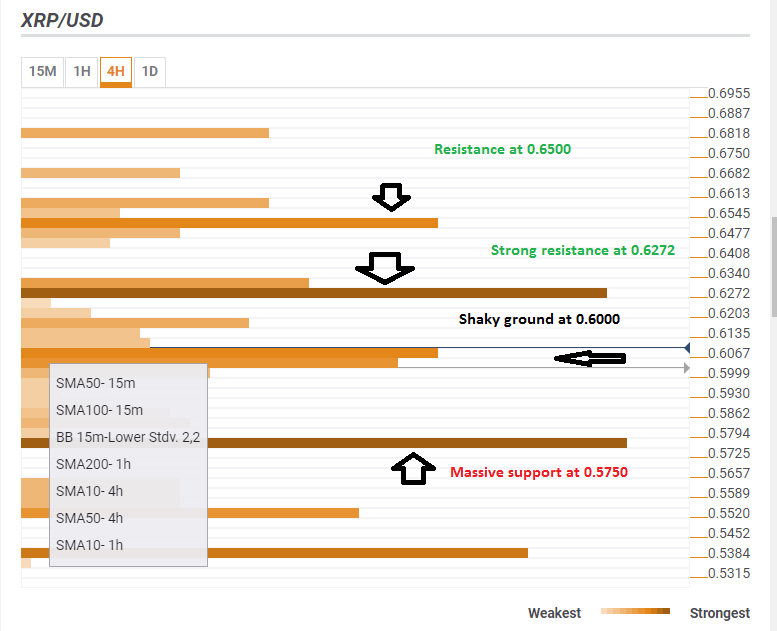
Contrary to the other blockchain biggies, Ripple (XRP/USD) is not looking that great. The $0.6000 is a convergence area of relatively weak support levels: the one hour low, the Fibonacci 23.6% one-week, the Simple Moving Average 50-15m, the SMA 100-15m, the Bolinger Band 15m-Lower, the SMA 200-1h, the SMA 50-4h, and more. While the list is long, no line stands out.
Stronger support is at $0.5750 which is the confluence of the one-month low, the one-week low, and the Bollinger Band one-hour Lower.
On the upside, $0.6272 is a critical cap: the Pivot Point one-day Resistance 1, the Fibonacci 38.2% one-week, the one-day high, and the Bolinger Band one-hour Upper converge there.
Further above on the upside, the $0.6500 area is a cluster featuring the Pivot Point one-day Resistance 2, the Fibonacci 61.8% one-month, and the Bolinger Band one-day Middle.
At current levels, there is somewhat more resistance than support for Ripple.
More: Latest cryptocurrency news


