Last week, the appreciation of the Japanese yen took price under the supportive trendline of the ascending trend that started at the beginning of 2019.
Long-term perspective
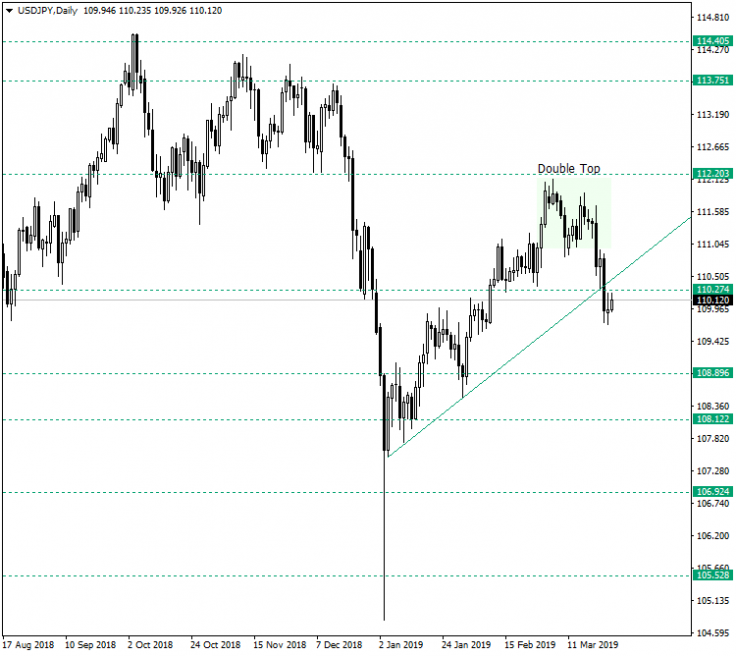
On the daily chart, after the rejection from the 105 support area on January 3, 2019, price undertook an ascending move that recovered most of the depreciation that began from the 114 resistance zone. On this path, the pair confirmed major support areas â 108.12, 108.89 and 110.27 â but failed to cross the 112.20 area, where it met the resistance which led to the formation of a double top. By following the projected move of the aforementioned chart pattern â which is about 120 pips â price reached the area just under the convergent support established by the 110.27 technical level and the support line of the ascending trend. This can be considered a break of an important support area and, thus, the ceasing â at least for now â of any bullish action on this instrument. However, as the move is already consumed, there should be other driving factors to push the pair further to the south. For the time being, none can be seen; but on the contrary, a high wave candle formed on March 25. Now, this candle pattern signals a potential return and, as it is preceded by a bearish move, the message would be that the bulls just might take action. So, a strong bullish candle closing above the high of the high wave â which, along with the candle on March 22, 2019, represents a morning star pattern â or simply a comeback above 110.27, signals that the bears do not actually have the control which could be depicted after an initial quick view of the chart.
Short-term perspective
Price is in a downwards move edged by the 111.61 resistance area of the double-top, the 110.87 throwback which materialized a higher high, and the 110.23 resistance of the current consolidation which took the form of a rectangle chart pattern. The rectangle has 109.73 as support. As long as this consolidation continues, chances are â at least on the short term â that price will try to make new lows, a first target being 109.12. However, a piercing of 109.73 would make possible one of these two scenarios. The first is a telling sign that the daily bullish takeover is underway. The second is that, if price comes back under 109.73, then more selling urge could be seen.
Levels to keep an eye on
D1: 110.27 112.20 108.89 108.12

H1: 110.23 110.87 109.73 109.12
If you have any questions, comments, or opinions regarding the Technical Analysis, feel free to post them using the commentary form below.