- GBP/USD has hit 1.2247 – the lowest in two years on fears of a hard Brexit.
- PM Boris Johnson has rejected the claim that the government is assuming no-deal.
- GBP/USD may challenge levels last seen in late 2016 / early 2017.
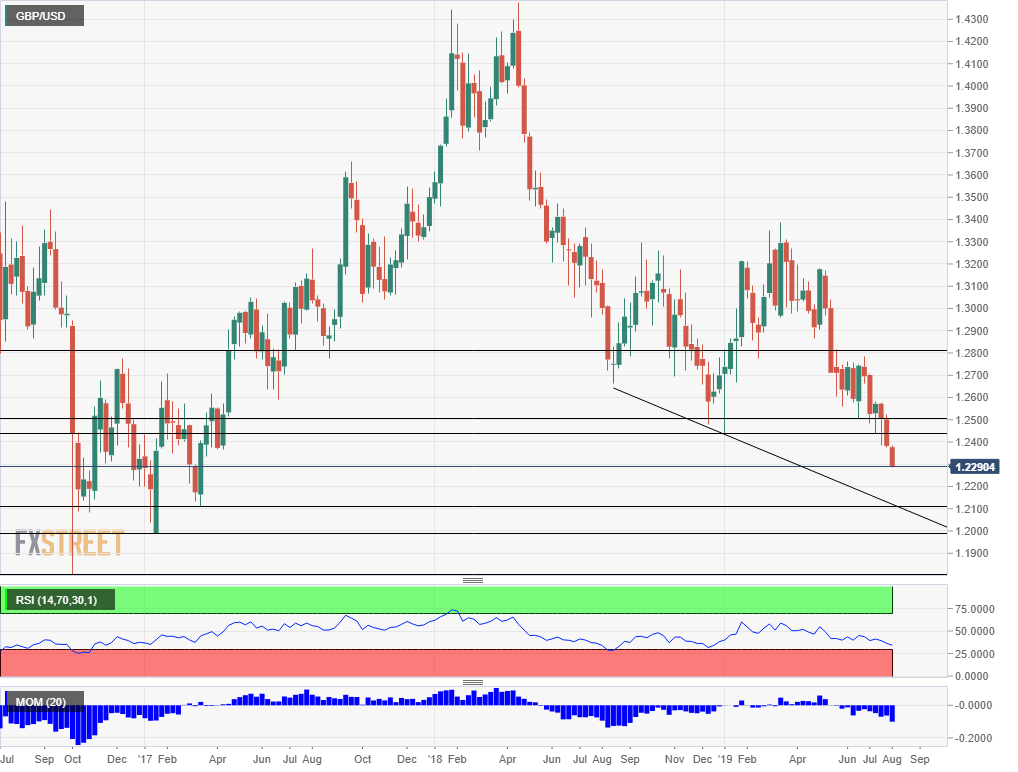
How low can the pound go? The pound’s plummet has turned into an avalanche as the new British government has “turbo-charged” its preparations for a no-deal Brexit. Michael Gove, a senior minister, said that a hard Brexit is a very likely prospect and the media has reported that this is the government’s working assumption. GBP/USD has hit a low of 1.2247 at the time of writing – last seen in March 2017.
PM Boris Johnson has helped stabilized Sterling by rejecting Gove’s claims that the government is now assuming a hard Brexit. He repeated his stance that a no-deal scenario has only a “million-to-one” chance.
However, markets are left unconvinced. It is time to look at lower levels for the pound. The more real a disorderly Brexit becomes, the more the pound can fall.
The next three downside levels for GBP/USD
The first of the three considerable levels on the weekly chart is 1.2110, which was the low point in mid-March 2017. After finding some stability cable shot up from there to 1.3000 within a short time.
The next level to watch is 1.1985, which was the low point in February 2017. While the dip was short-lived, GBP/USD remained depressed afterward.
The third and final line is 1.1806. It was recorded in a “flash crash” move back in October 2016, and despite the rapid nature of the crash, it remains the all-time low for GBP/USD.
Looking up, the first broad upside target is 1.2440, which was a double-bottom earlier this year. It is closely followed by 1.2500 (or 0.80 on USD/GBP) which provided support in the spring. Next, we find 1.2780 that diminished hopes of a recovery attempt.
Get the 5 most predictable currency pairs

