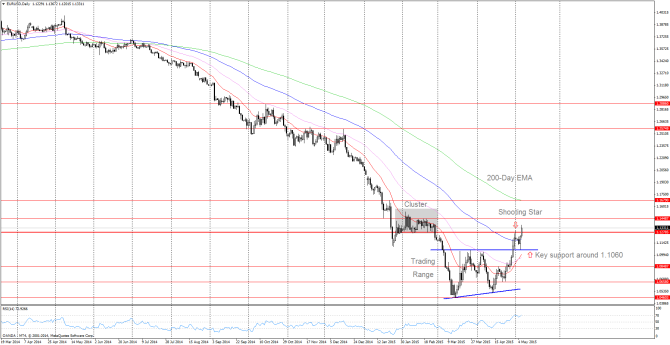
EUR/USD (daily chart as of May 6, 2015) has temporarily broken out of a trading range (two bold blue lines on chart) since April 29. The pair tested the key support level yesterday around 1.1060, which was the upper border of the prior trading range.

Current price is above the resistance level around 1.1280, which has been serving as an important support level from late January to late February (the cluster area on chart in gray shadow). If the pair can hold 1.1060 and clear the barrier of 1.1280, it could continue the upward momentum to test 1.1450, and then potentially 1.1680 level.
To the downside, if 1.1280 remains as resistance, it would put more downward pressure on price. A breakdown below 1.1060 would invalidate the trading range breakout, and could drive price lower to test 1.0850 and then potentially 1.0660 level.
Note that on May 1, a potential shooting star candlestick formed right around 1.1280 resistance level, which was a possible weakening sign. Watch closely the price action against 1.1280 level in the following trading sessions.
Support levels:
1.1060 (trading range upper border)
1.0850 (April 17 high)
1.0660 (April 21 low)
Resistance levels:
1.1280 (cluster area support)
1.1450 (multiple highs)
1.1680 (January 21 high or 200-day EMA)
Upcoming risk events:
German Factory Orders m/m — Thursday, May 7, 2:00am
US Unemployment Claims — Thursday, May 7, 8:30am
US Non-Farm Employment Change — Friday, May 8, 8:30am
