The safe haven yen and euro are not only moving by the fundamentals of gloom but also by technical levels. The team at Bank of America Merrill Lynch analyze:
Here is their view, courtesy of eFXnews:
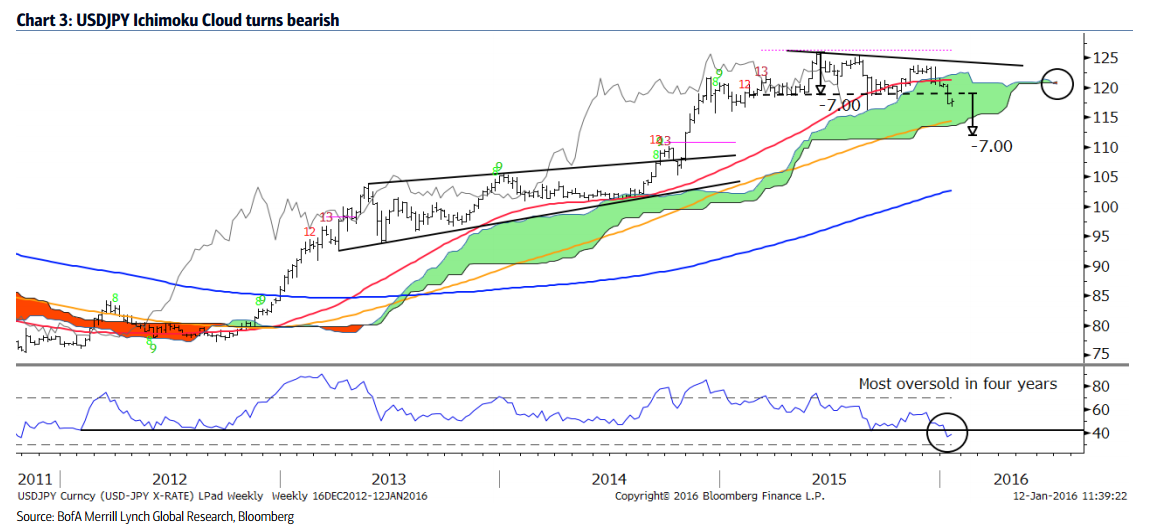
USDJPY broke below major support by closing under 118.40, a level that supported the uptrend on a closing basis for over a year.
Less the late-August whipsaw low of 116.18, this creates a sequence of lower highs and lower lows. USDJPY’s multi-year uptrend is ending. The current trend is increasingly likely to bounce, and we recommend selling strength. We see major resistance at 121.80 where the 50d is crossing below the 200d moving average.
USDJPY weekly chart shows a bearish cloud cross. One of the important bearish signals we discussed in our 13 December report, Technical Advantage: USD/JPY shows signs of weakness, was the pending cross of the Ichimoku cloud. The cross occurred, and the cloud is officially in a bearish position. This happened with RSI breaking support and showing a bearish momentum.
USDJPY may trade down to the 100wk moving average and the bottom of the rising cloud at about 114-115.50. Given the triangle top, a measured move suggests 112 is even a possibility. A rise to the 50wk average and top of the cloud at about 120.75 would be a great place to go short, in our view.

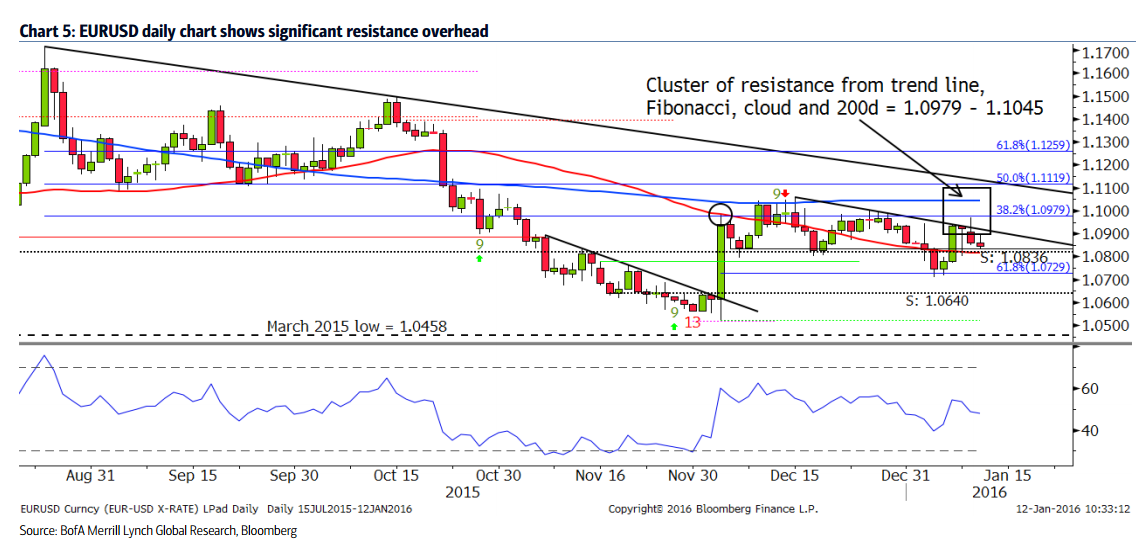
EURUSD faces foreboding resistance. The amount of resistance the EURUSD has to contend with is significant. A short-term trend line, 38.2% Fibonacci retracement, Ichimoku cloud, 200d moving average and long-term trend line remain above price.
The biggest cluster of resistance is between 1.0979-1.1045. The long-term trend line and 50% retracement align at about 1.1119. A decisive close into resistance could be a signal that the trend may rise, though we are doubtful.
The overall trend remains lower, and we look to support at 1.0836, 1.0640 and March lows of 1.0458.

For lots more FX trades from major banks, sign up to eFXplus
By signing up to eFXplus via the link above, you are directly supporting Forex Crunch.
